
Every part number, measured on time on wing and cost
In the demo airline, component removals are more than half the cost of unreliability. Fleet Intelligence shows which part types come off too soon, which serials keep coming back, which shop sends them back early, and which part number to standardise on.
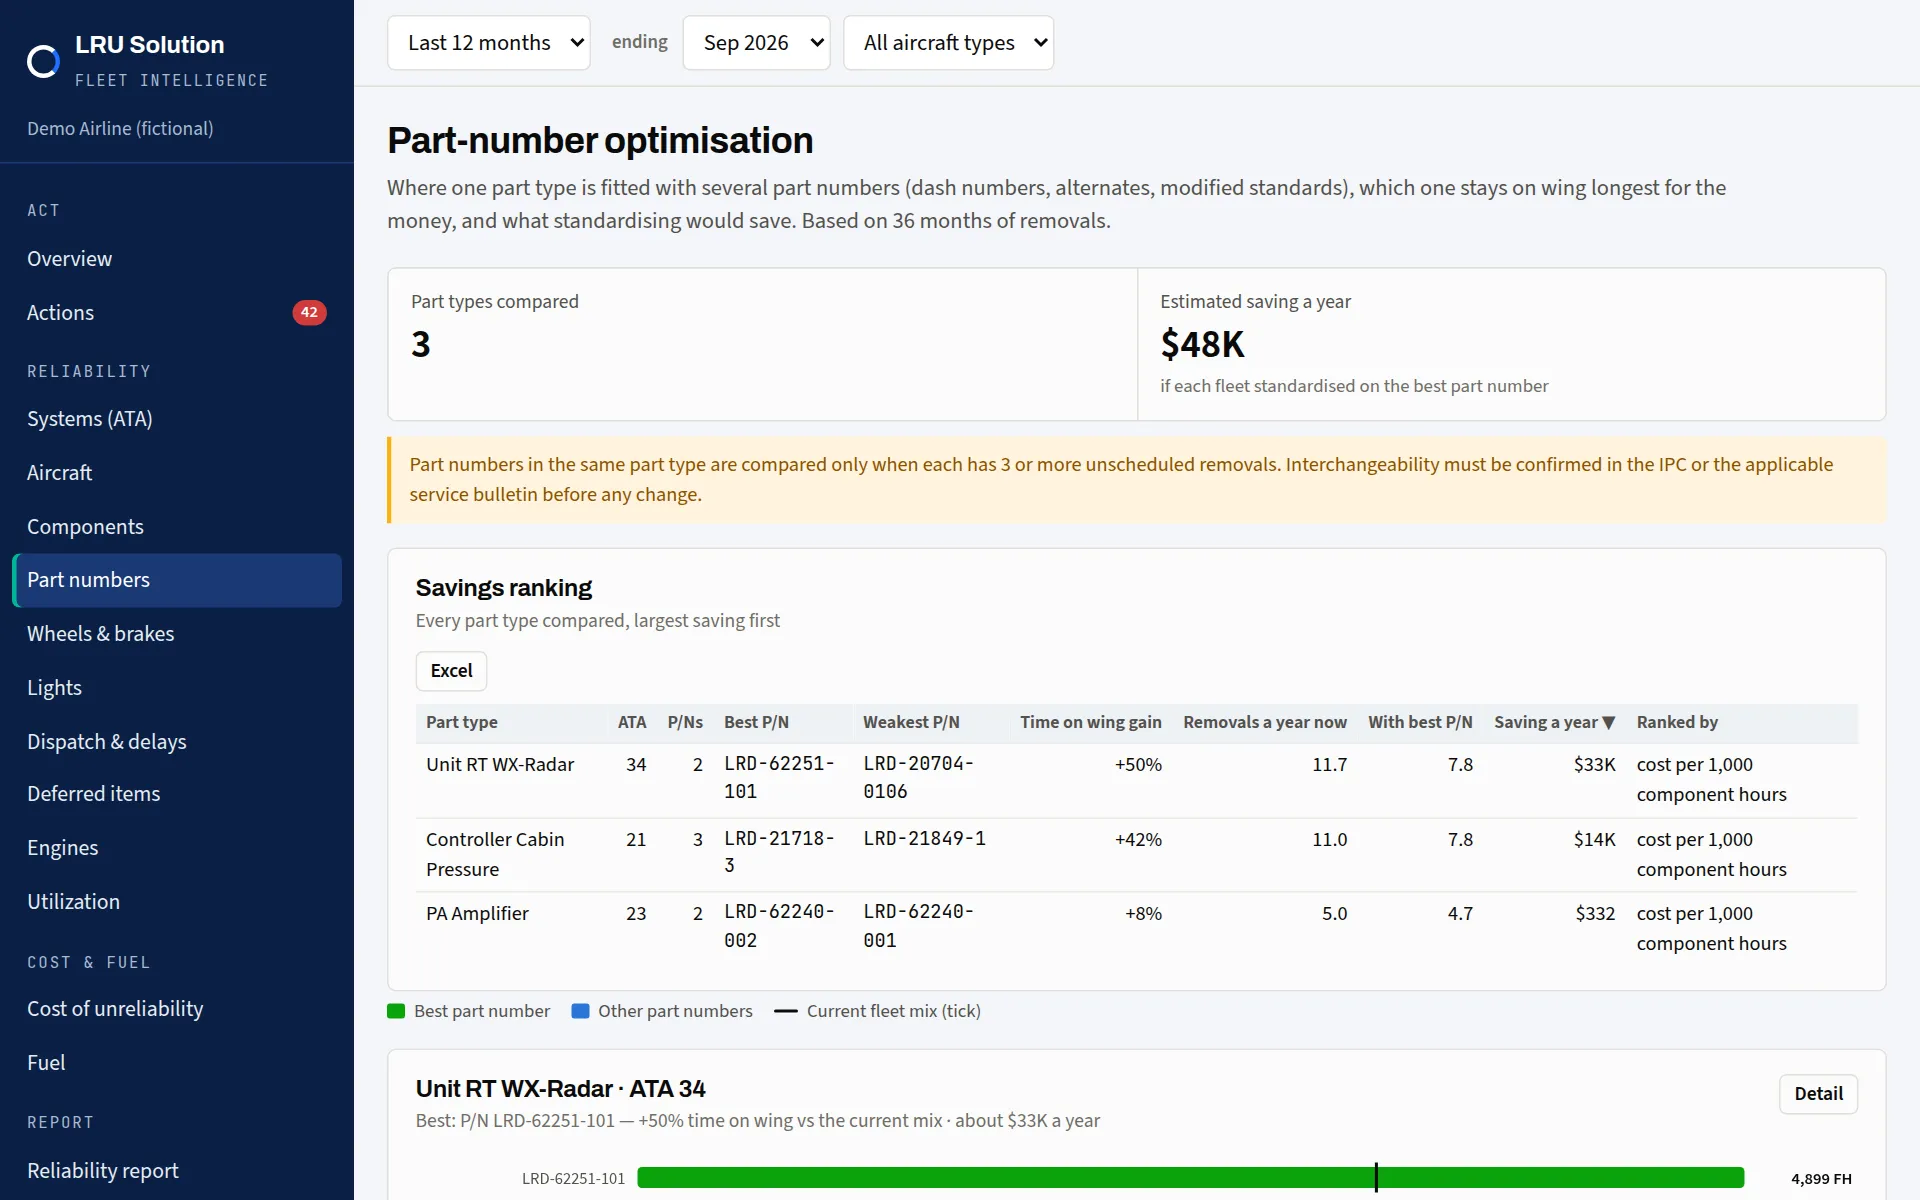
Which part number stays on wing longest
Where one part type is fitted with several part numbers — dash numbers, alternates, modified standards — they are compared on time on wing and cost per 1,000 component hours over 36 months. You see the best, the removals a year now and with the best, and the saving.
Interchangeability must be confirmed in the IPC or the service bulletin. Every recommendation says so.
Fictional airline, example costs.
The measures a component engineer needs
MTBUR with its confidence
Removals, unscheduled removals, confirmed failures and no-fault-found; MTBUR with a 90% lower bound, MCBUR, MTBR, and MTBF where enough shop findings exist; cost per 1,000 component hours.
Wear-out or early failure
Weibull analysis of time since installation. Wear-out points to a soft-time removal that turns unscheduled removals into planned ones; early failures point to installation or repair quality.
Wear items ranked separately
Wheels, tyres, brakes, oxygen, slides, filters and lamps are ranked on their own, so they no longer hide the rotables in the top ten.
The serial that keeps coming back
A unit removed three or more times when about one removal would be expected, or repeatedly after very short time on wing.
Whose repairs last
Units from one shop that come back significantly sooner than from the best shop, with a statistical test before it's raised.
Enough, and not too many
Spares needed for your chosen fill rate from demand and repair turnaround: short stock is an AOG risk, surplus is money on the shelf.
The wear items, done properly
Wheels and brakes by position
Removals per position per 1,000 flight hours and per 1,000 landings, with a test for a position removed significantly more often than the others. Works from removal records, technical-log action codes, or your wheel and brake workbook.
Wearing faster?
Landings between removals, year on year. In the demo airline, brakes fell from 1,475 to 1,226 landings between removals.
Lights and LED
Lamp changes by ATA 4-digit position, their cost a year, and the payback of an LED retrofit once you enter the kit price.
What the parts checks raised
A weather radar serial removed four times
Median time on wing 363 FH against an MTBUR of 3,816 FH for the part type. The action: quarantine it and ask the shop for the root cause.
ADIRU: 40% of removals had no fault
$43,146 a year at stake if half of those removals are avoided with better troubleshooting.
Two ADIRU spares more than demand needs
About $240,000 of stock on the shelf, while the cabin pressure controller is three spares short of a 95% fill rate.
Starter air shutoff valves wear out
A Weibull fit with R² 0.99 on 53 removals: a planned soft-time removal before the B10 life would turn surprises into scheduled work.
Fictional airline, example costs.
Your removals, and your catalogue if you have it
One row per removal with the part number, serial, reason, shop finding, time since installation and cost where you have them. If only monthly counts per part number exist, your CAMO system's pivot export is read as it is. The part catalogue (quantity per aircraft, prices, turnaround, stock) makes MTBUR, cost and spares exact.