
What every flight should have burned
Fleet Intelligence builds a burn model from your own flights, then finds the aircraft that burn more than it predicts, the maintenance that changed their burn, and the fuel carried home that didn't need to be, with what each costs a year.
Four checks on every flight you import
Expected burn, from your flights
A least-squares model per route where there are 40 flights or more, otherwise per aircraft type, on flight time, take-off weight and weight times time. No benchmark from another airline.
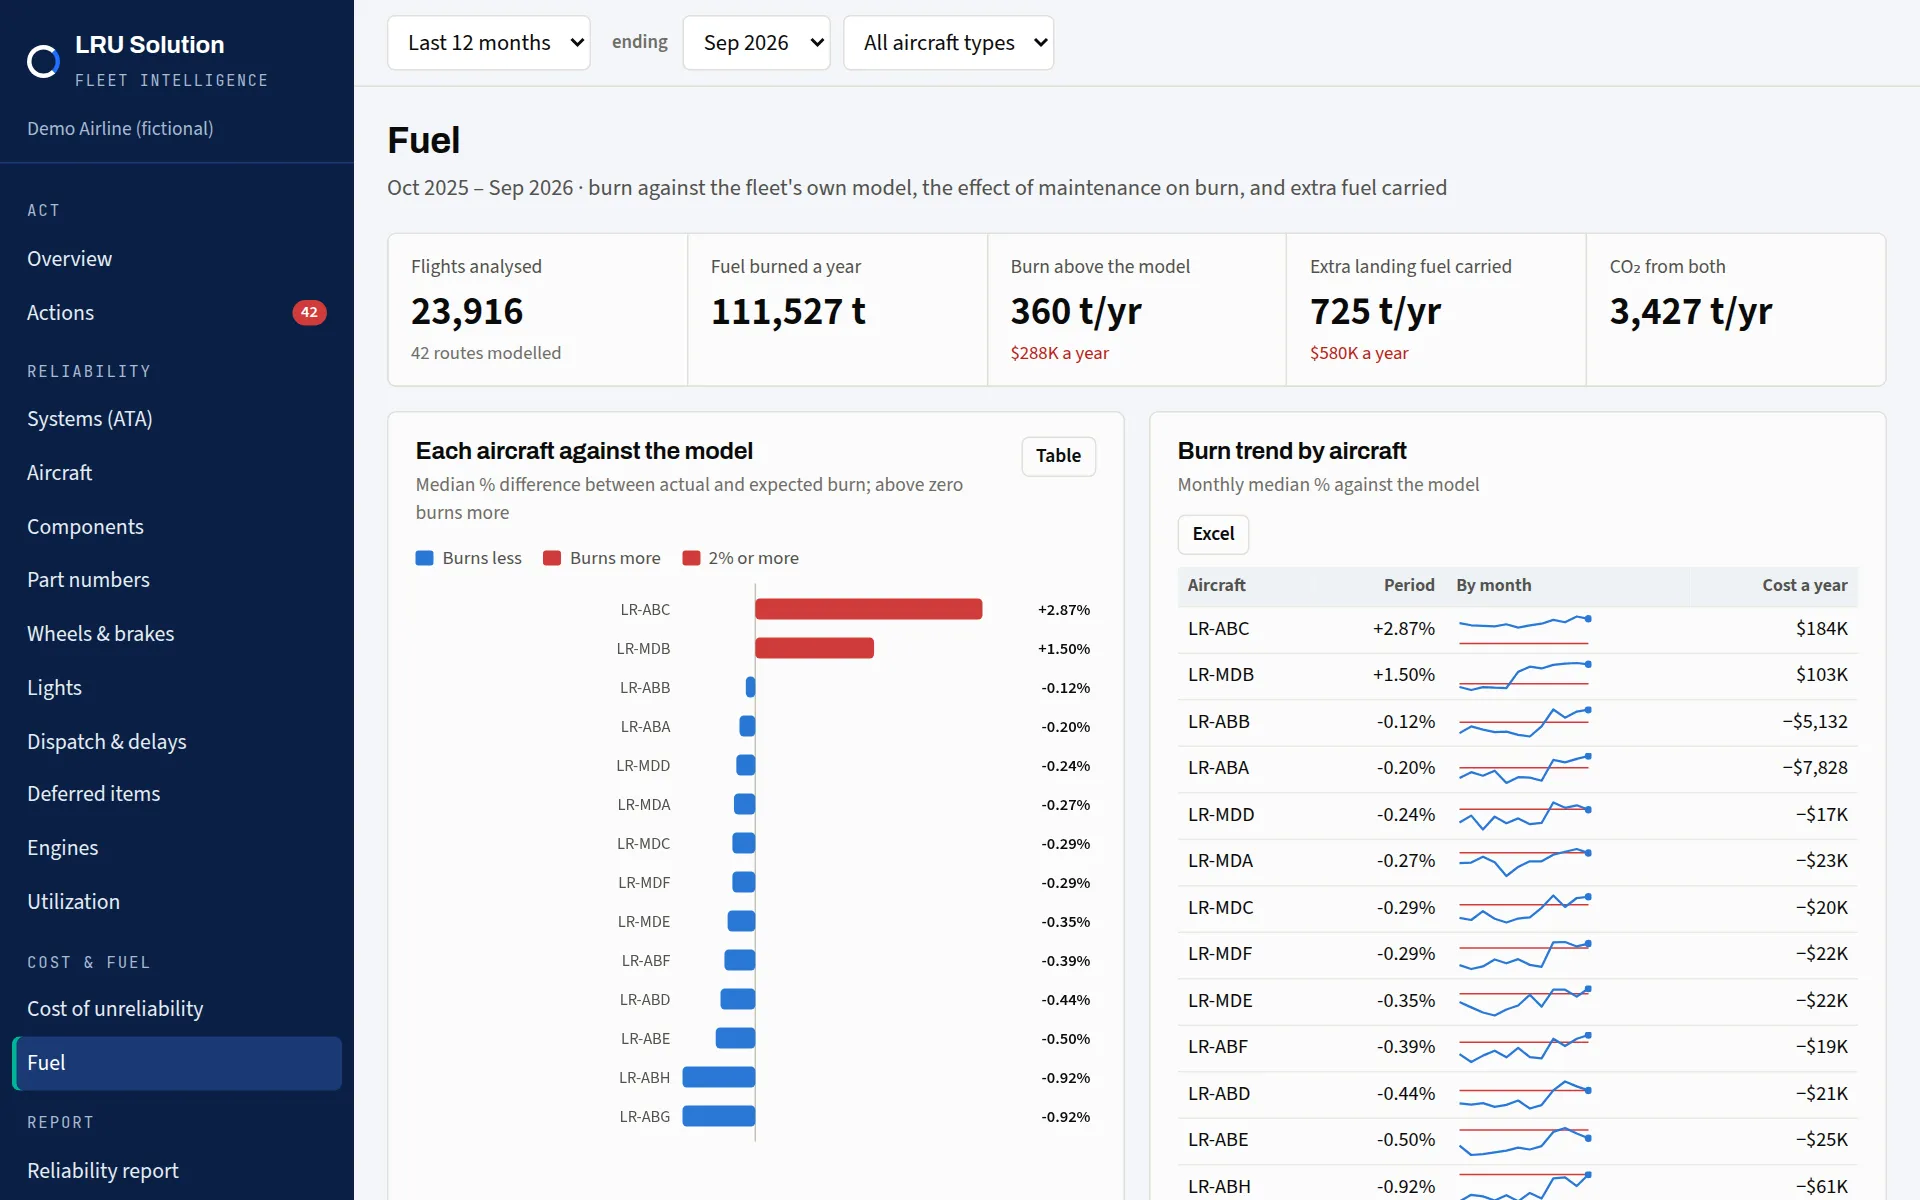
The tails that burn more
Each aircraft's median deviation from the model, its excess tonnes and their cost a year, and its monthly trend. An aircraft 2% or more above the model becomes an action.
Work that changed burn
Burn 30 days before and after each removal on a fuel-relevant system or engine change. A shift of 1.5 points or more is flagged.
Fuel carried home
Landing fuel above plan, or above the route's best decile where no plan is recorded, and what carrying it costs. Plus the CO₂ of all of it.
What the fuel checks raised
A fictional airline with 14 aircraft and 23,916 flights a year, with the platform's example fuel price of $800 a tonne.
Fuel carried home: $579,649 a year
724.6 tonnes a year burned only to carry landing fuel above plan. The action: review discretionary fuel by route with flight operations.
One aircraft burns 2.87% more: $184,409 a year
LR-ABC, measured against the model on the same routes, weights and flight times.
3,427 tonnes of CO₂ a year
From the excess burn and the carried fuel together.
Eleven years of one MD-80 operator
We studied 133,763 real flights and 58,068 technical-log defects from a regional MD-80 operator, anonymised. The study went further than the platform's standard checks: crew technique on the same route and type, flight time against the best flights, and the effect of the season.
6.5% of fleet fuel burn
- Engine-related decline, fleet-wide1,900 t
- Crew technique, same route and type370 t
- Extra flight time on the route350 t
- One aircraft's condition229 t
- Fuel carried home at landing180 t
One row per flight
Registration, date and fuel burn are enough to start. Route, take-off weight and airborne time make the model much sharper; landing fuel and planned landing fuel add the carried-fuel check.
Any change to fuel policy must stay within the legal fuel minimums and be approved by flight operations.