
See it on an airline before you send a file
Two ways to look: the platform itself on a fictional demo airline, run through the real rules, and an interactive fuel study on eleven years of a real MD-80 operation.
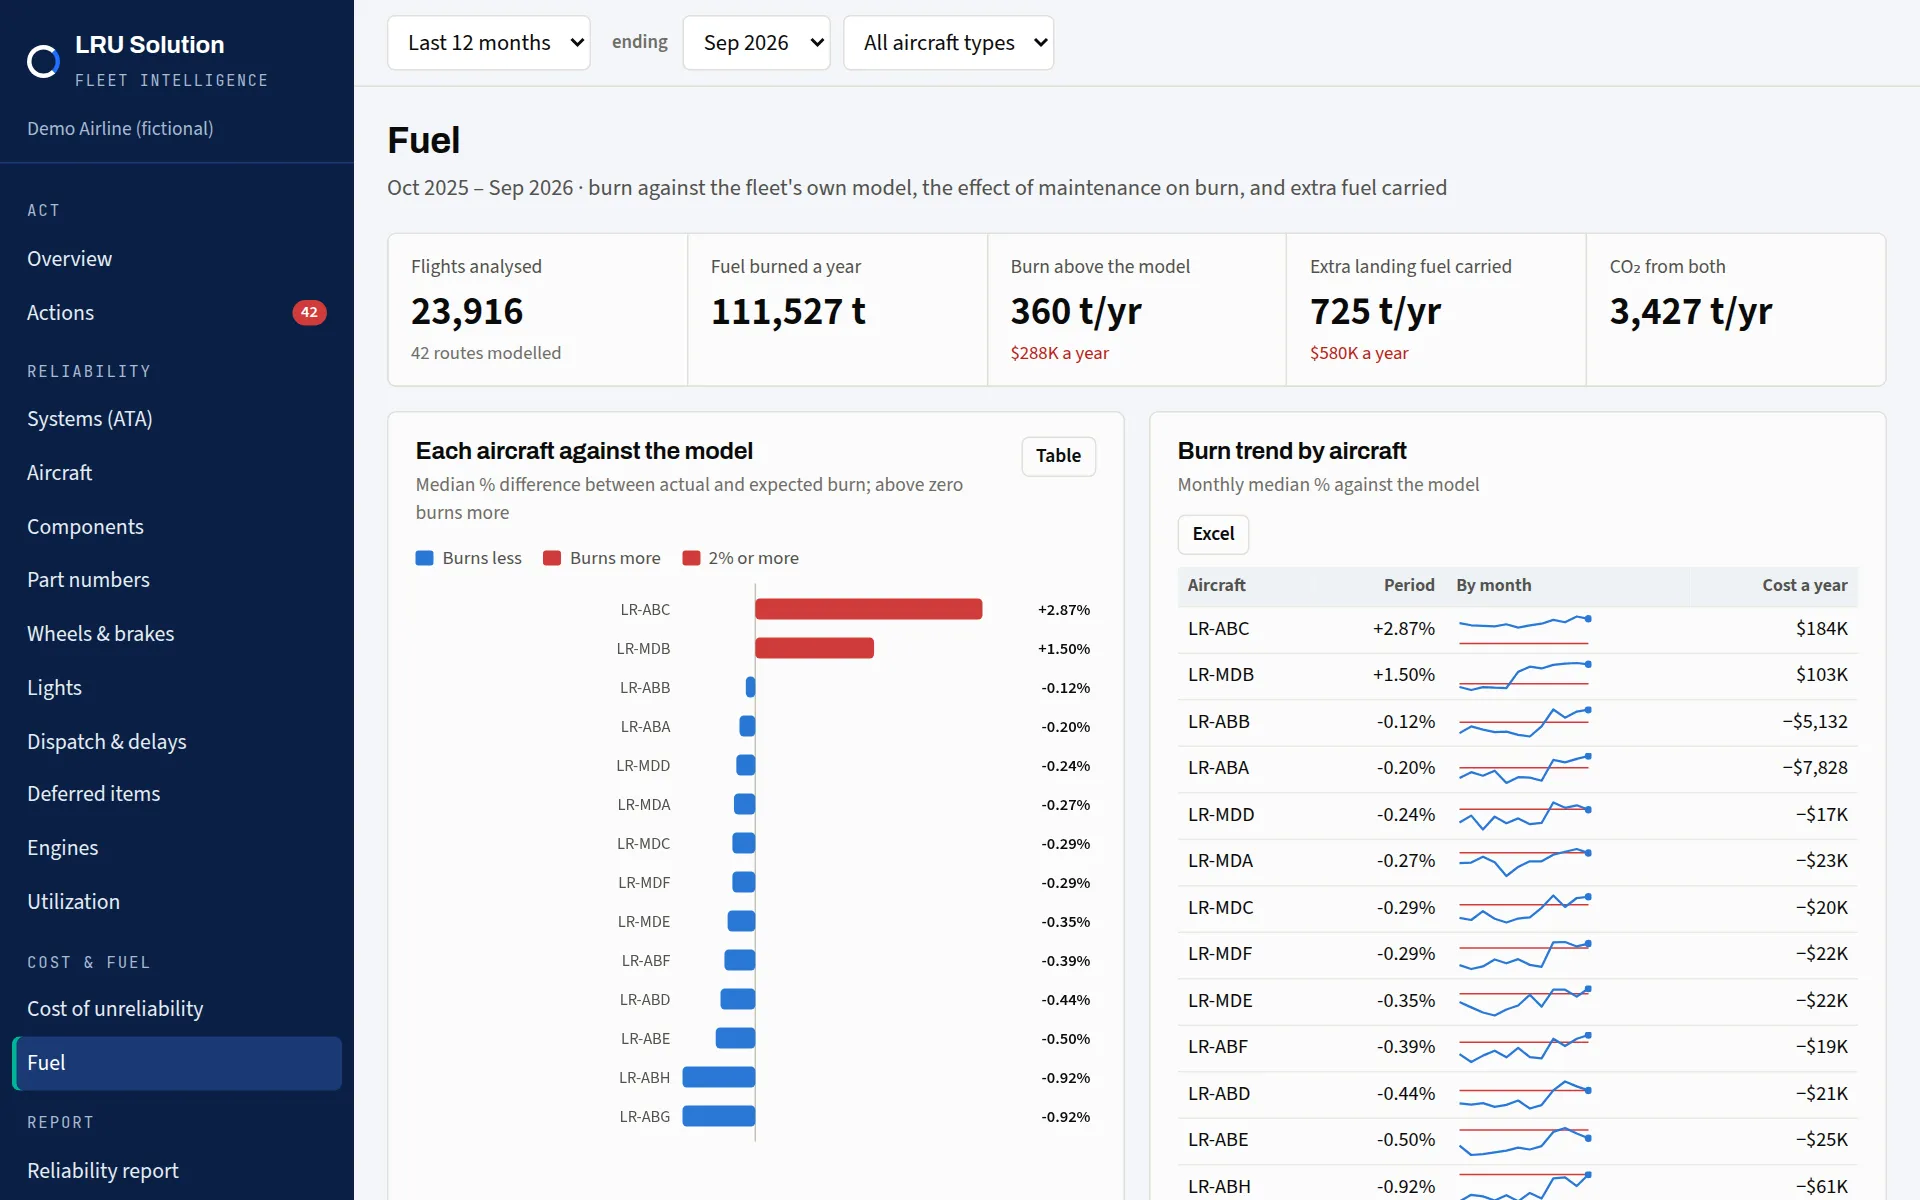
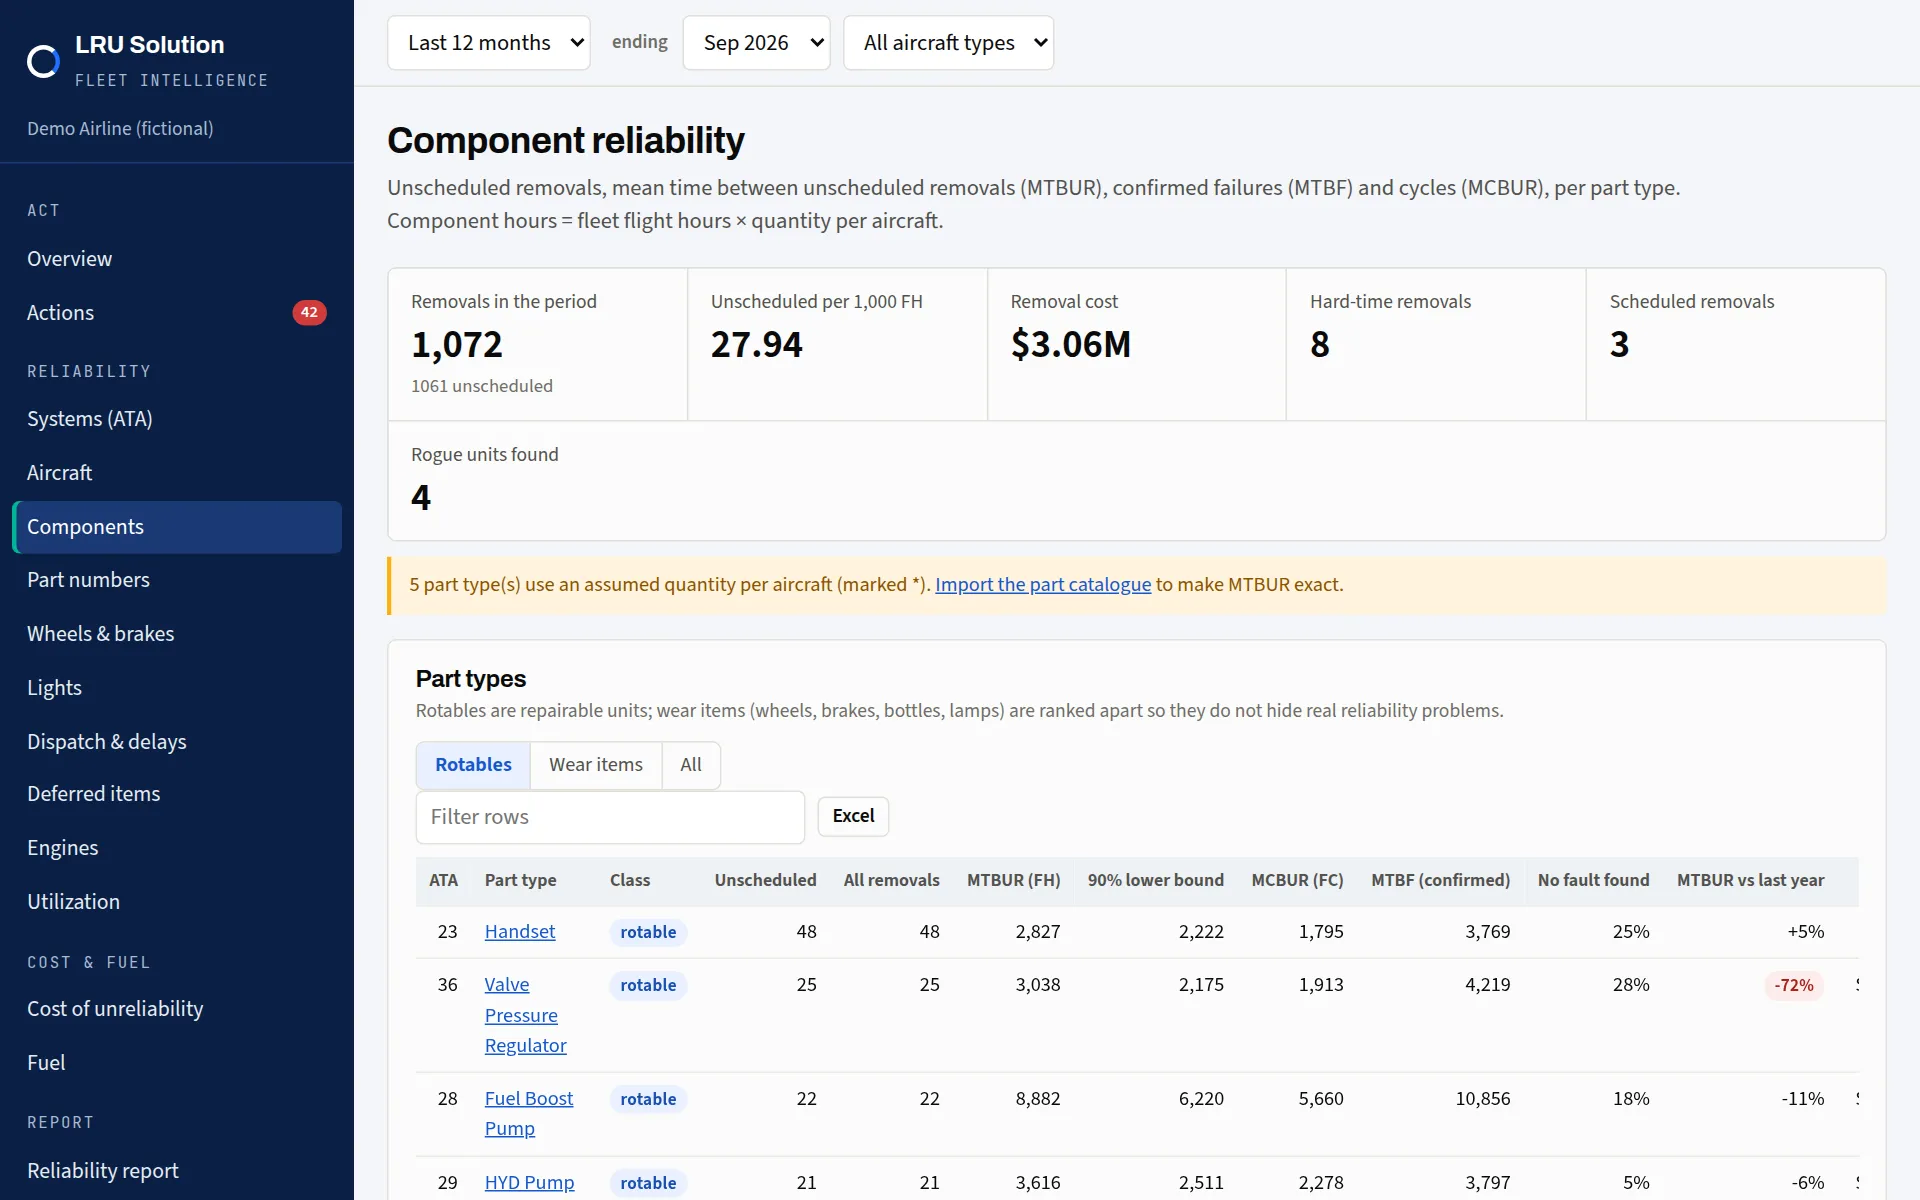
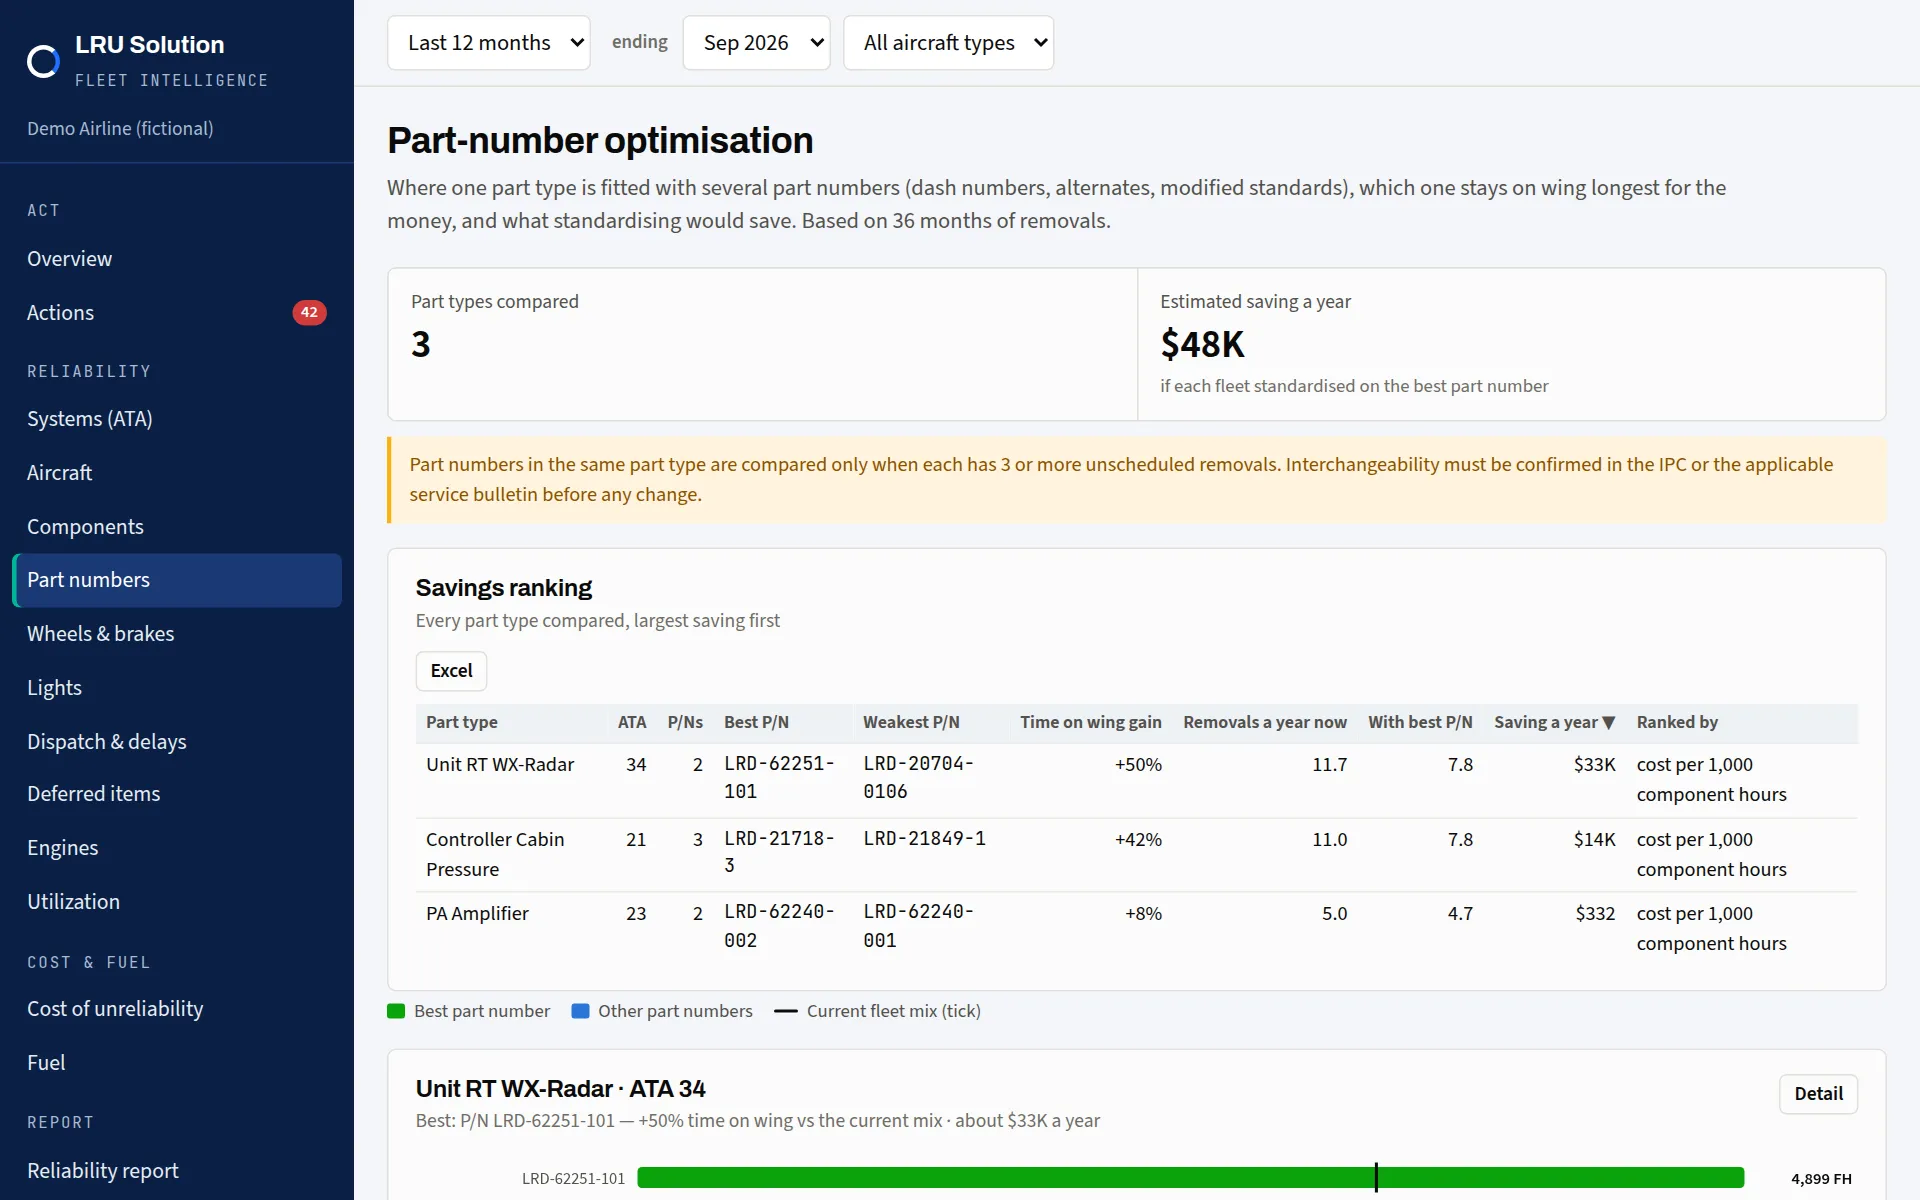
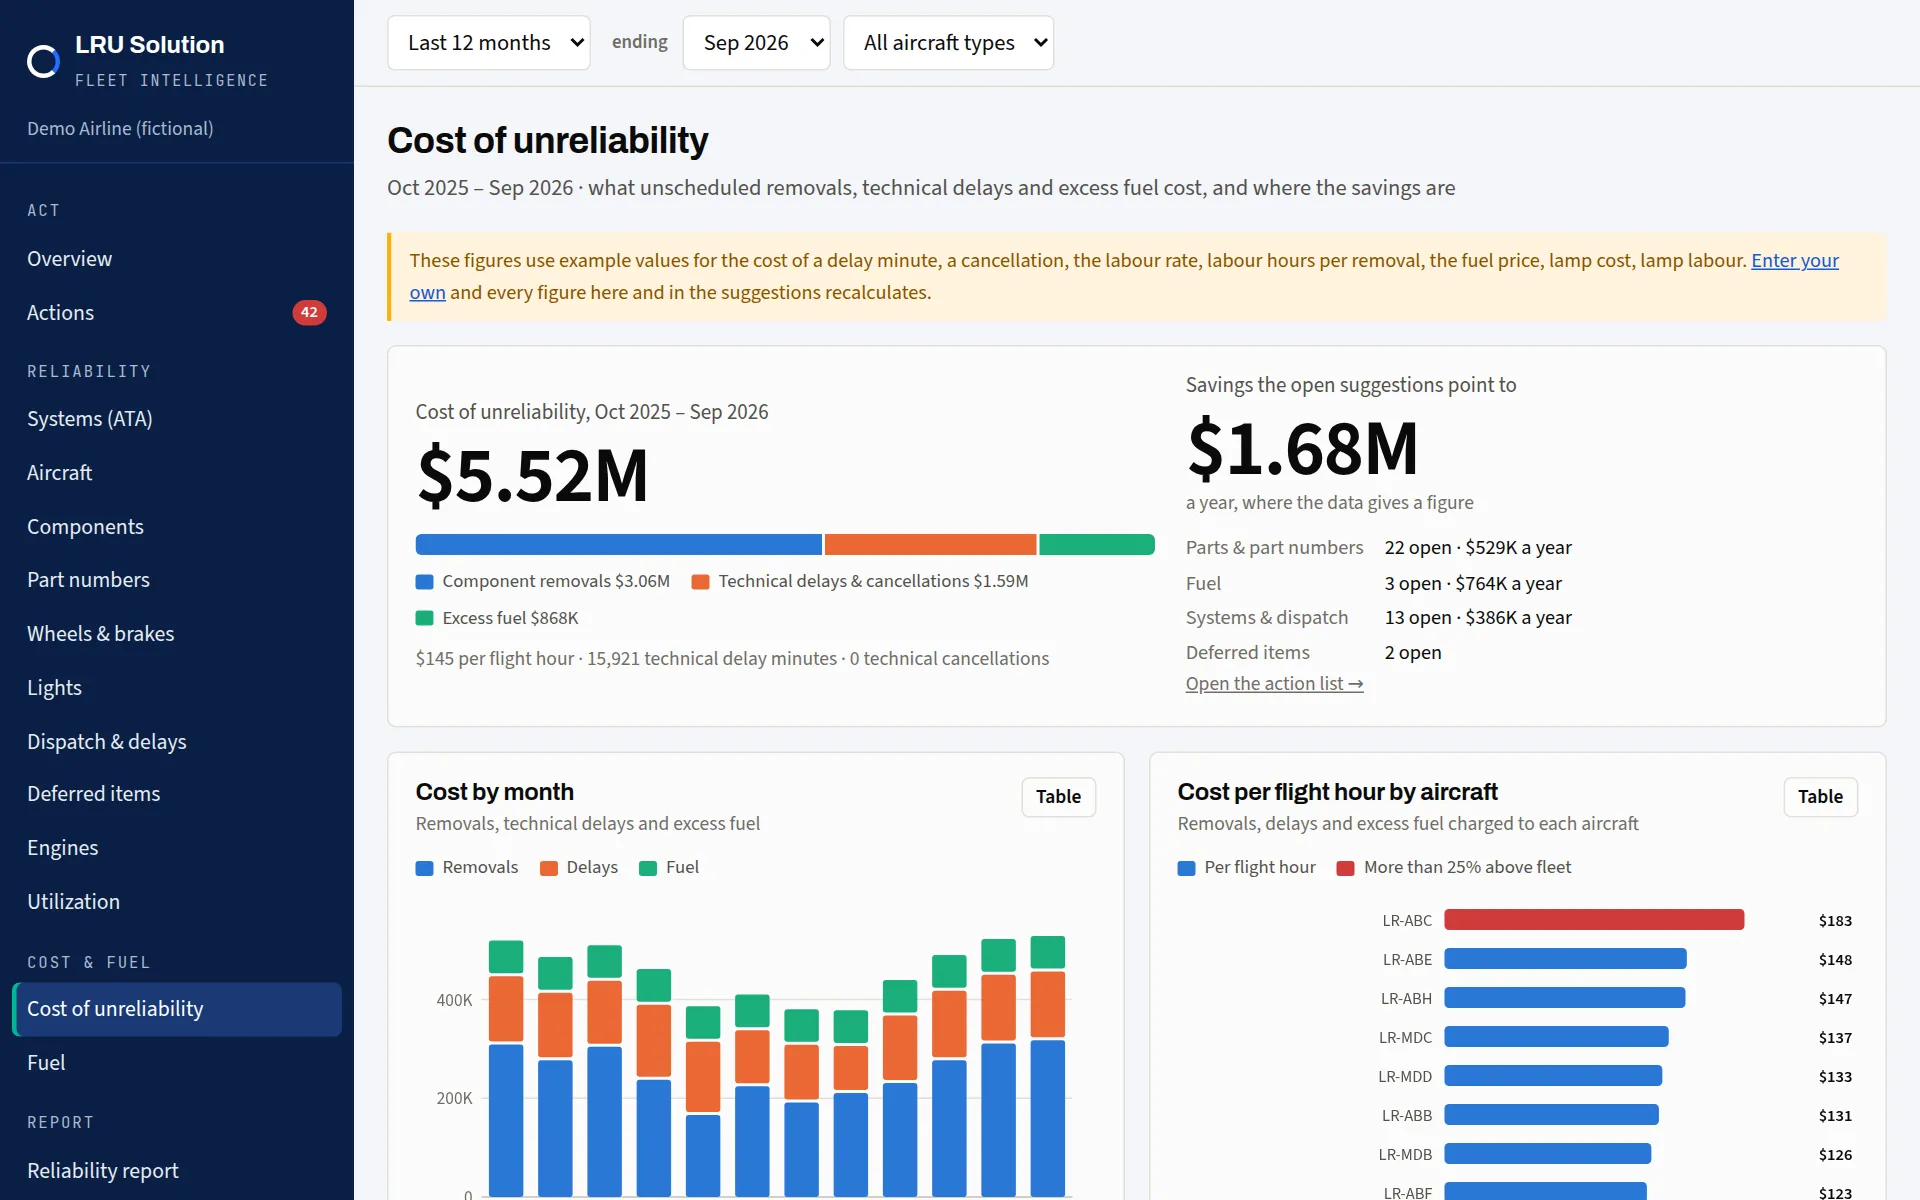
Fleet Intelligence, screen by screen
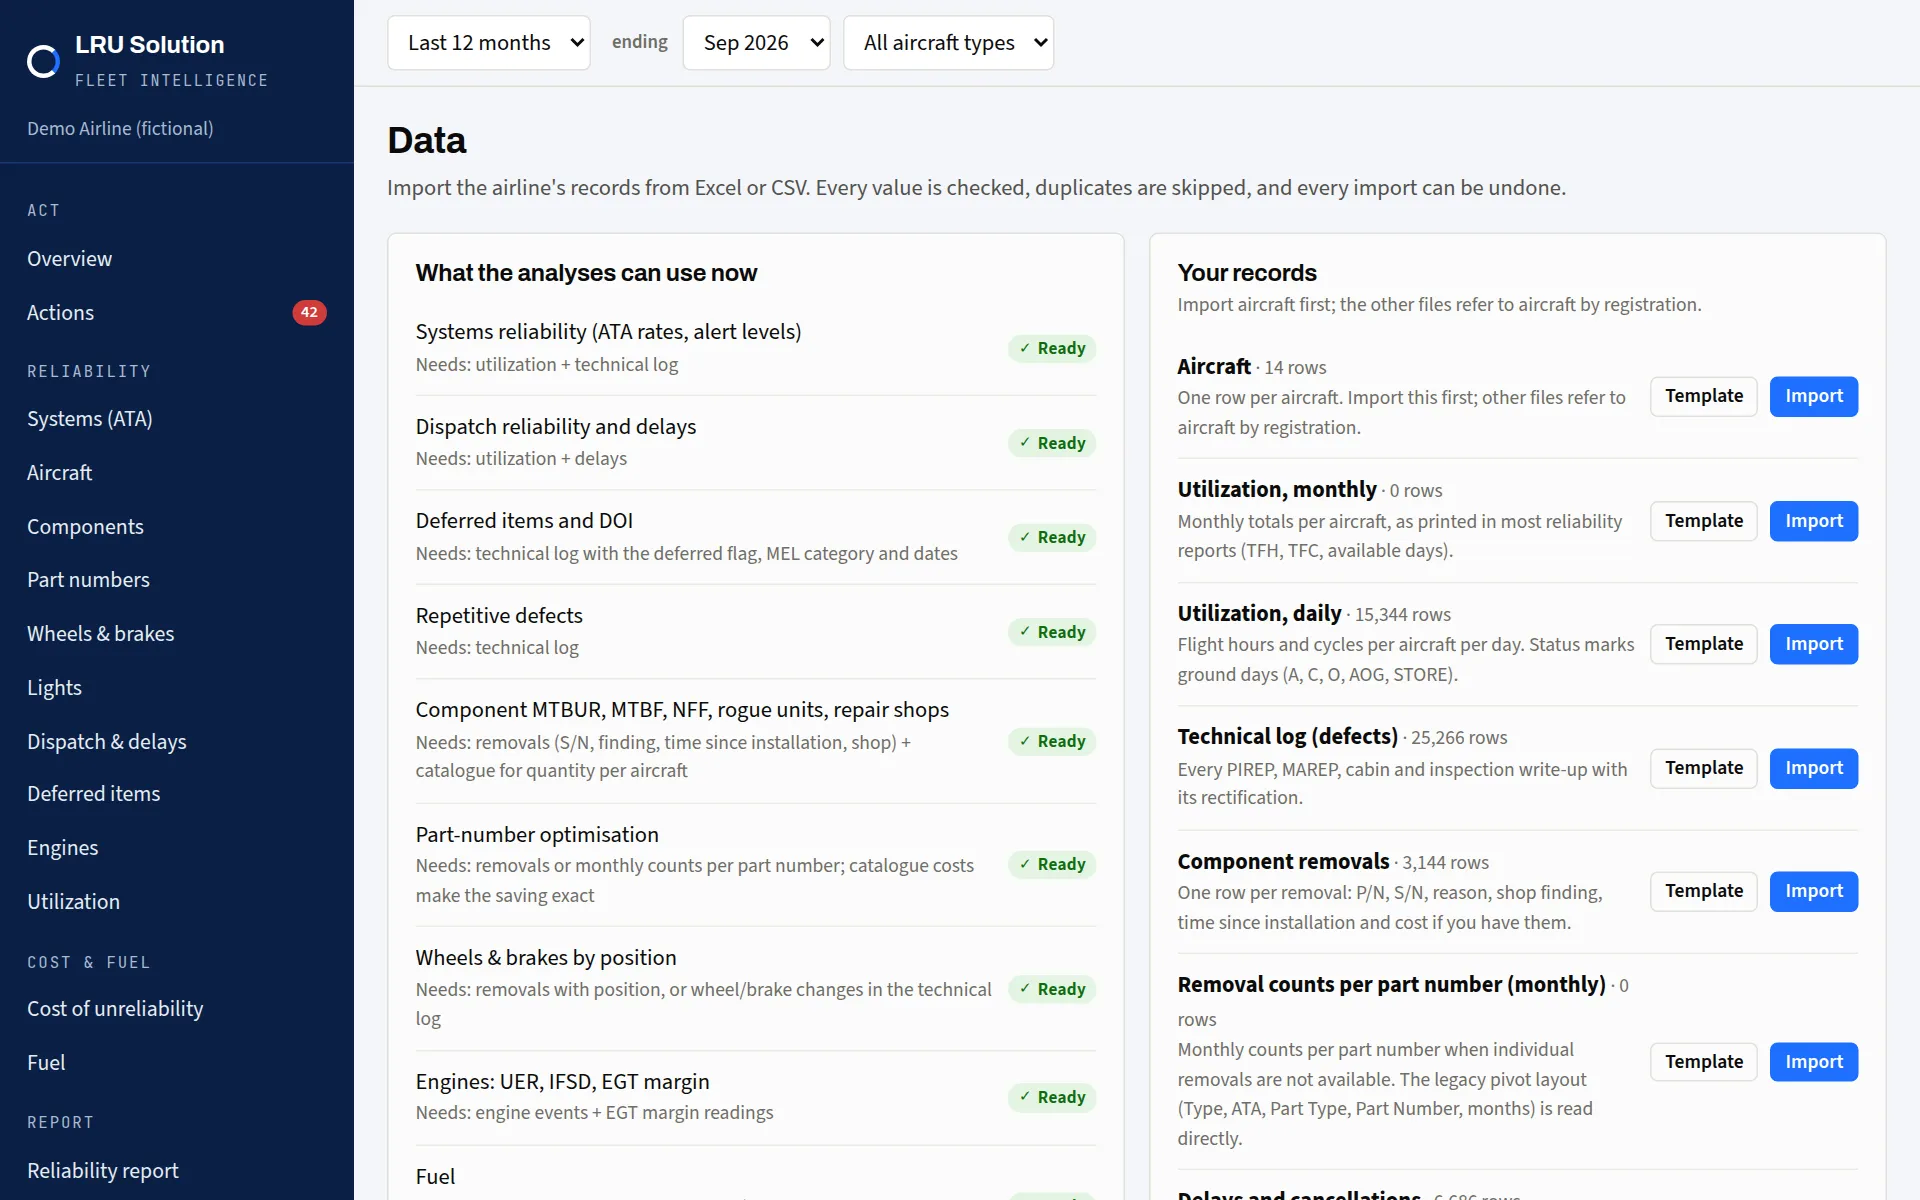
A fictional airline: six MD-83s and eight A320-family aircraft, three years of records, every registration, serial and part number invented. The figures are what the platform worked out from them.
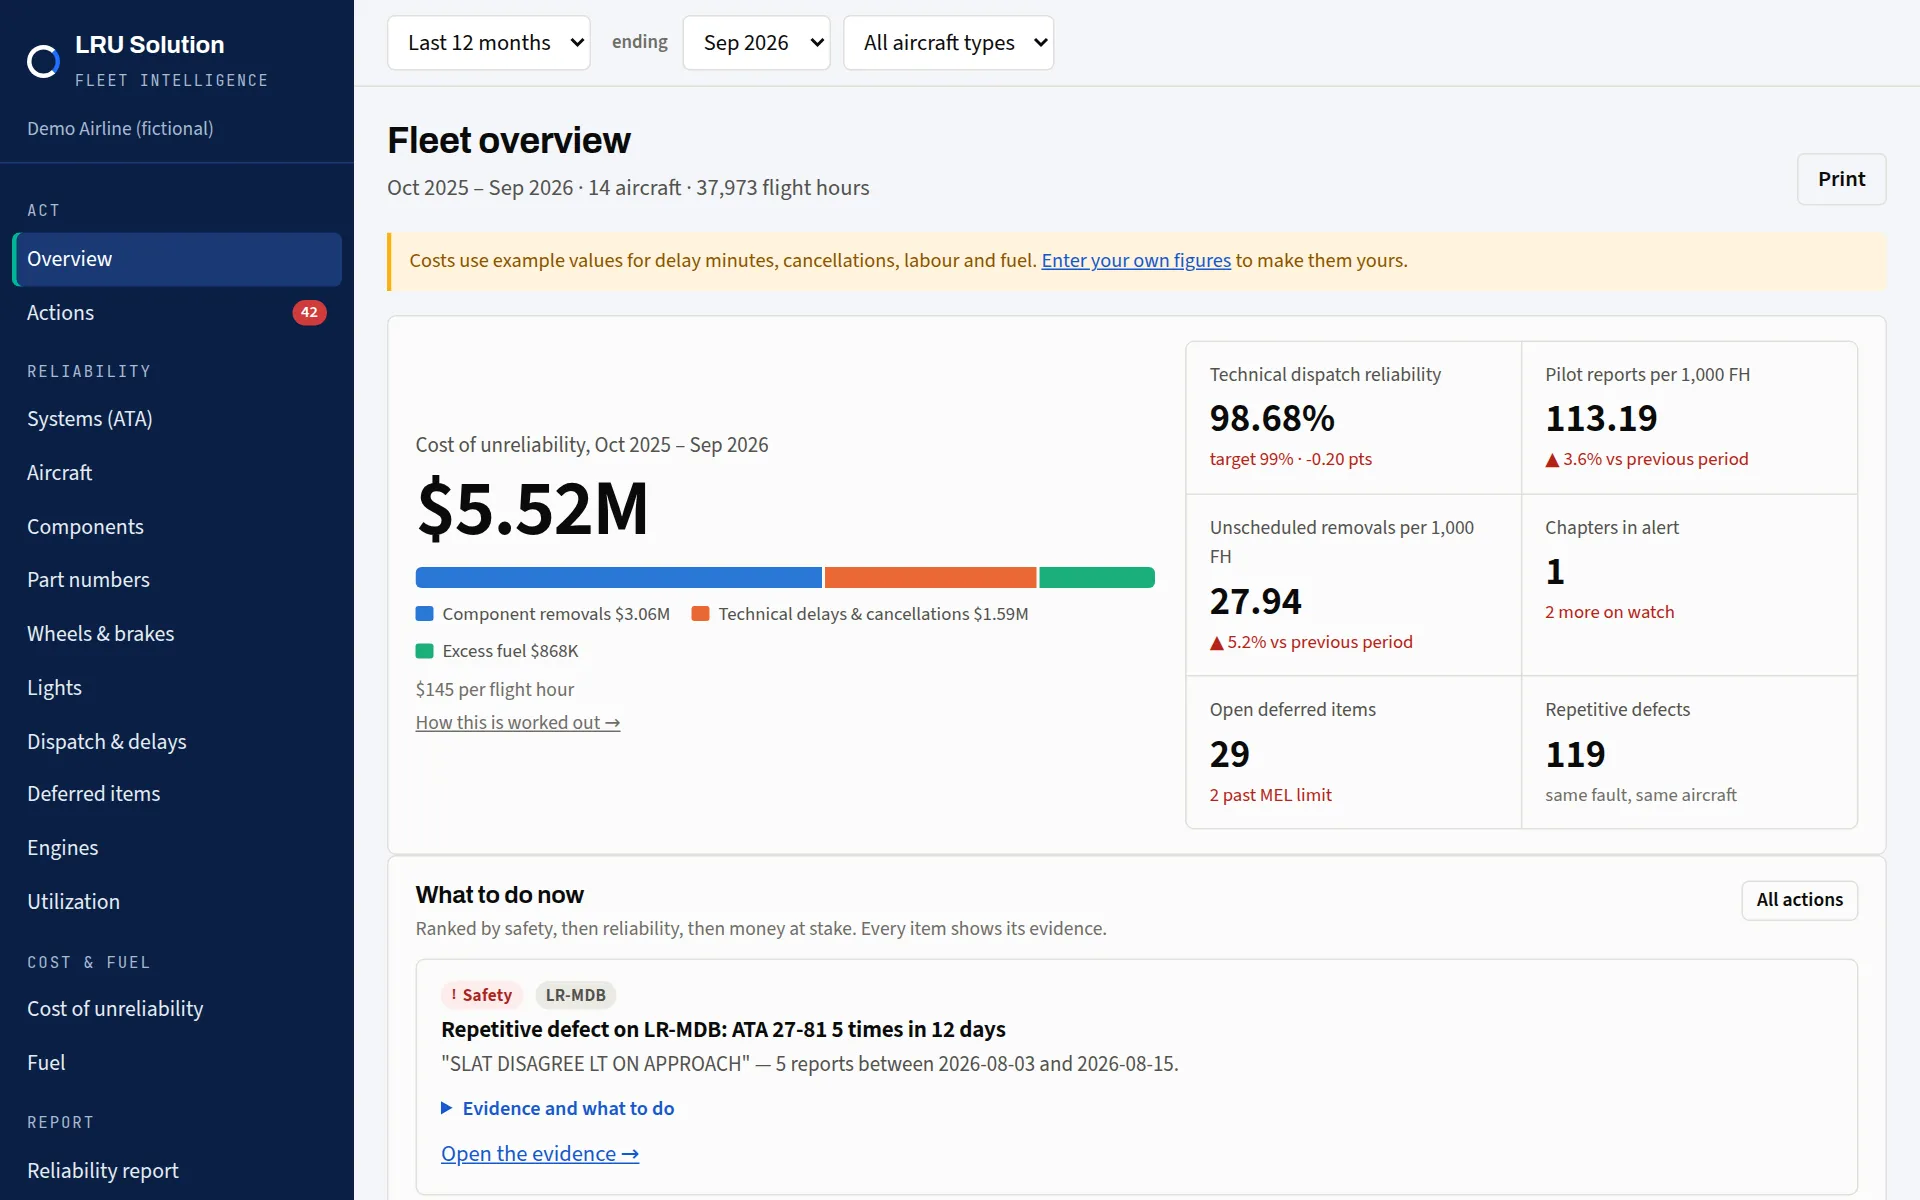
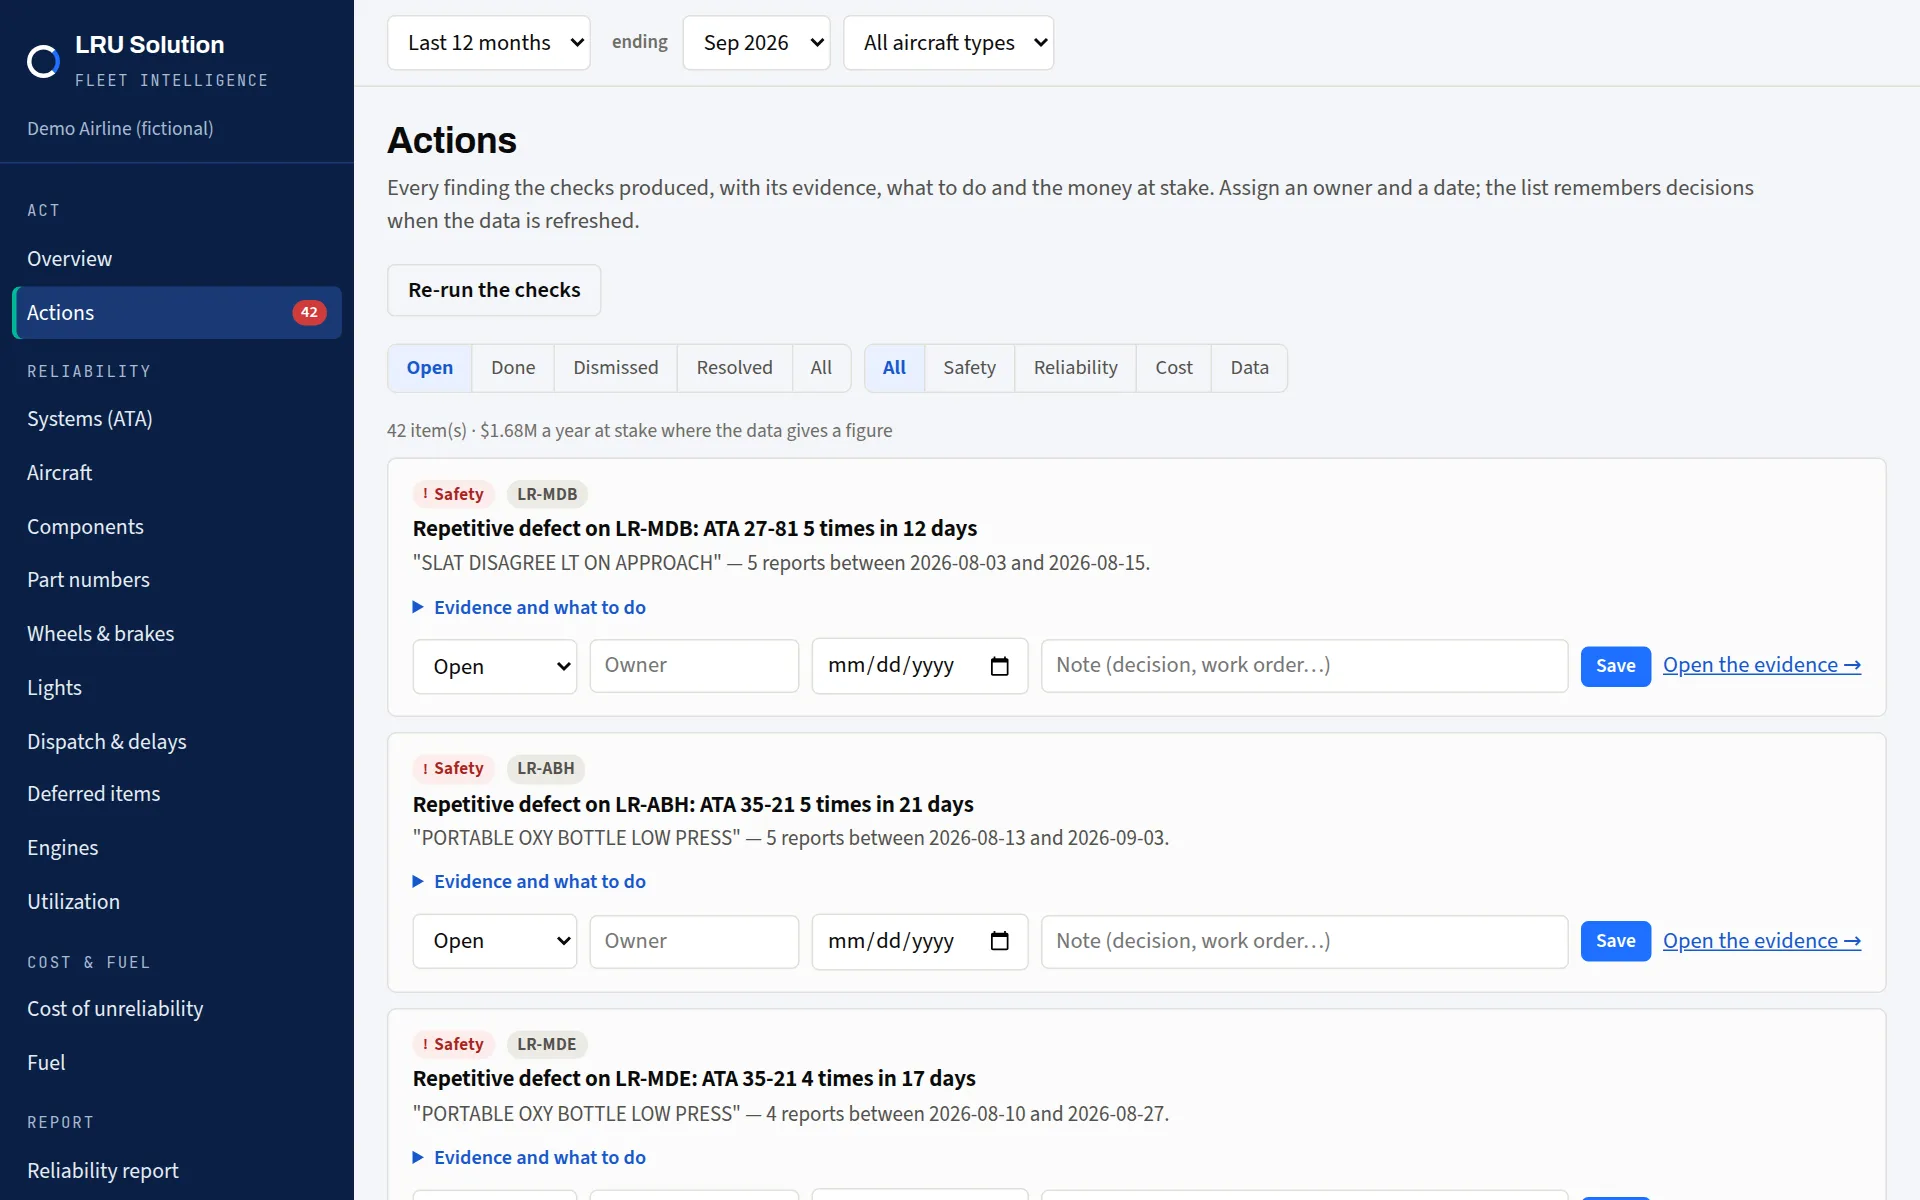
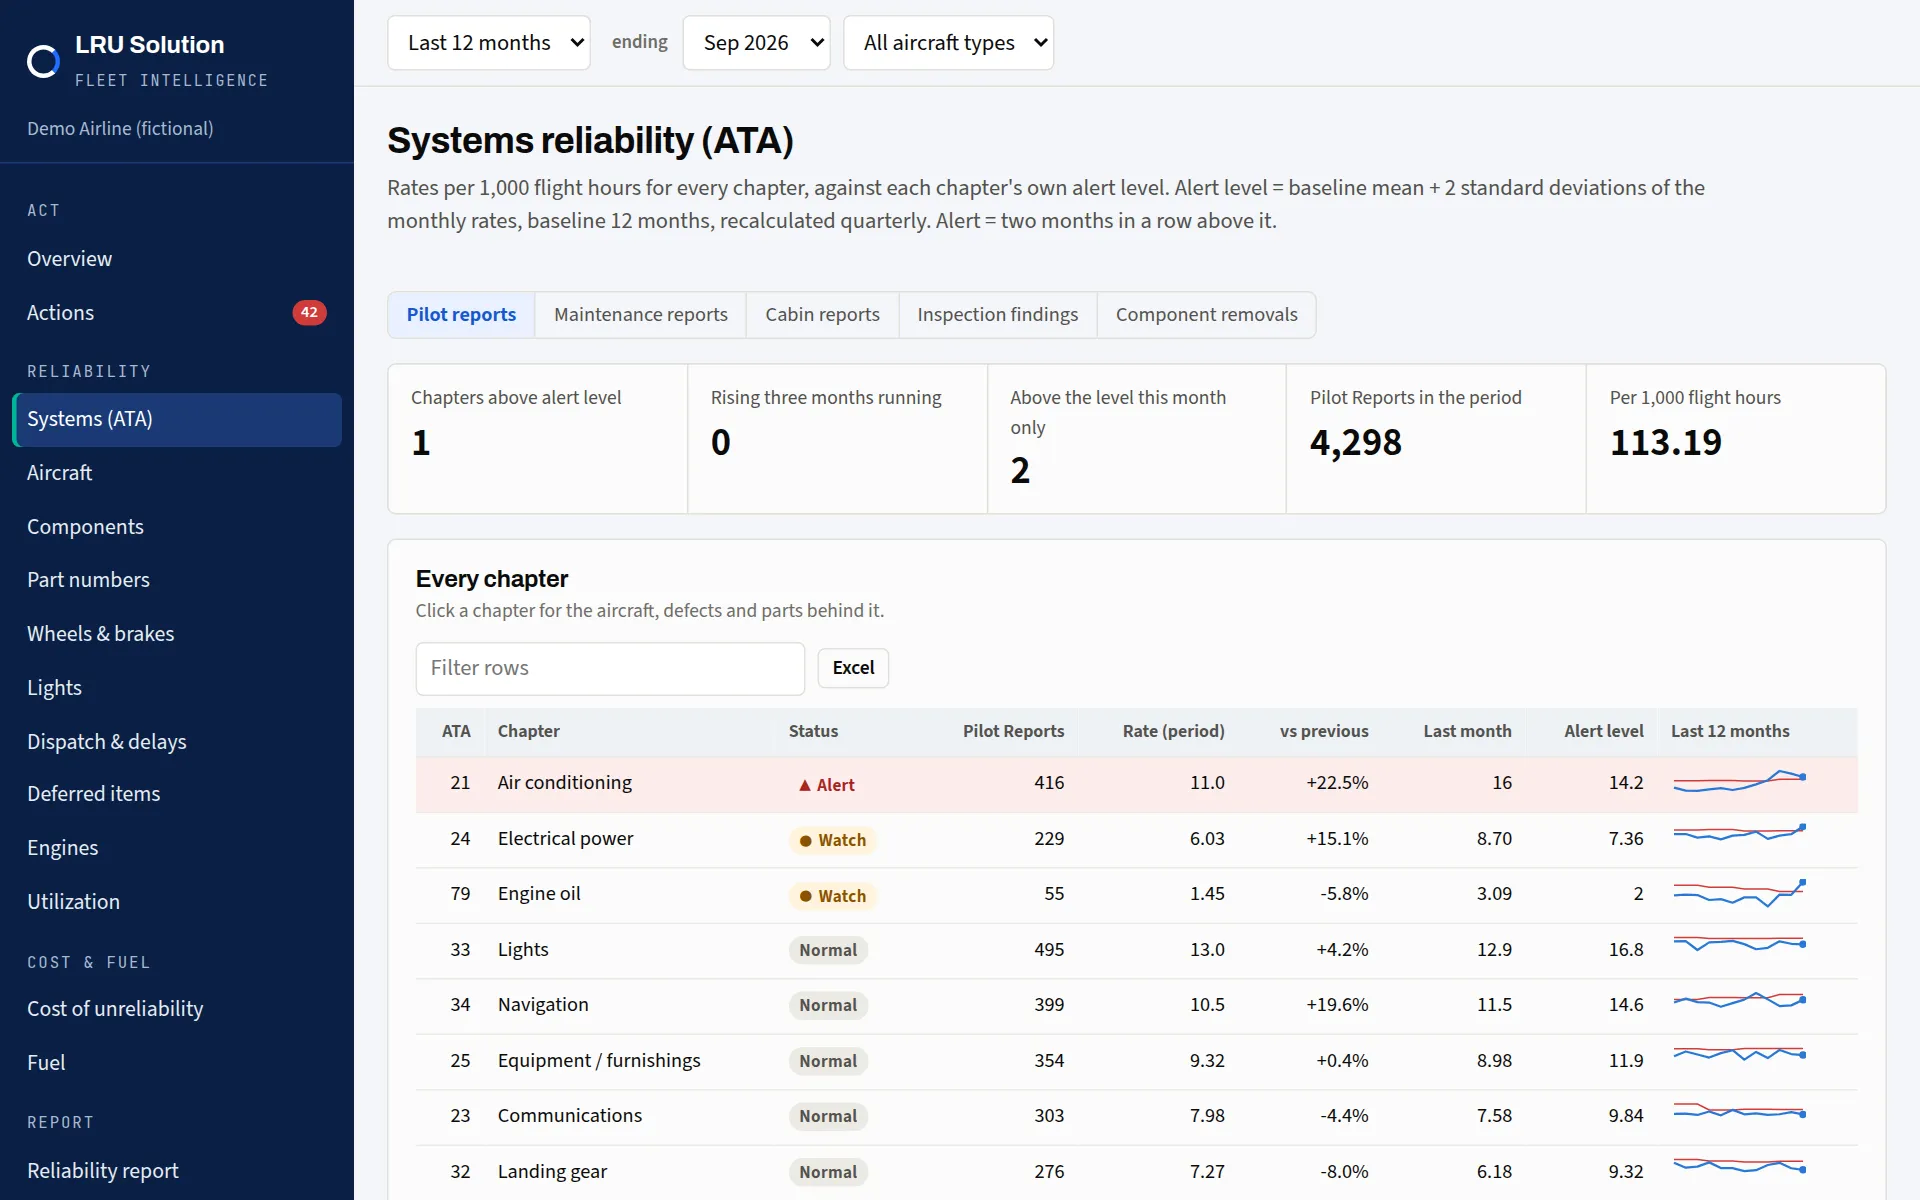
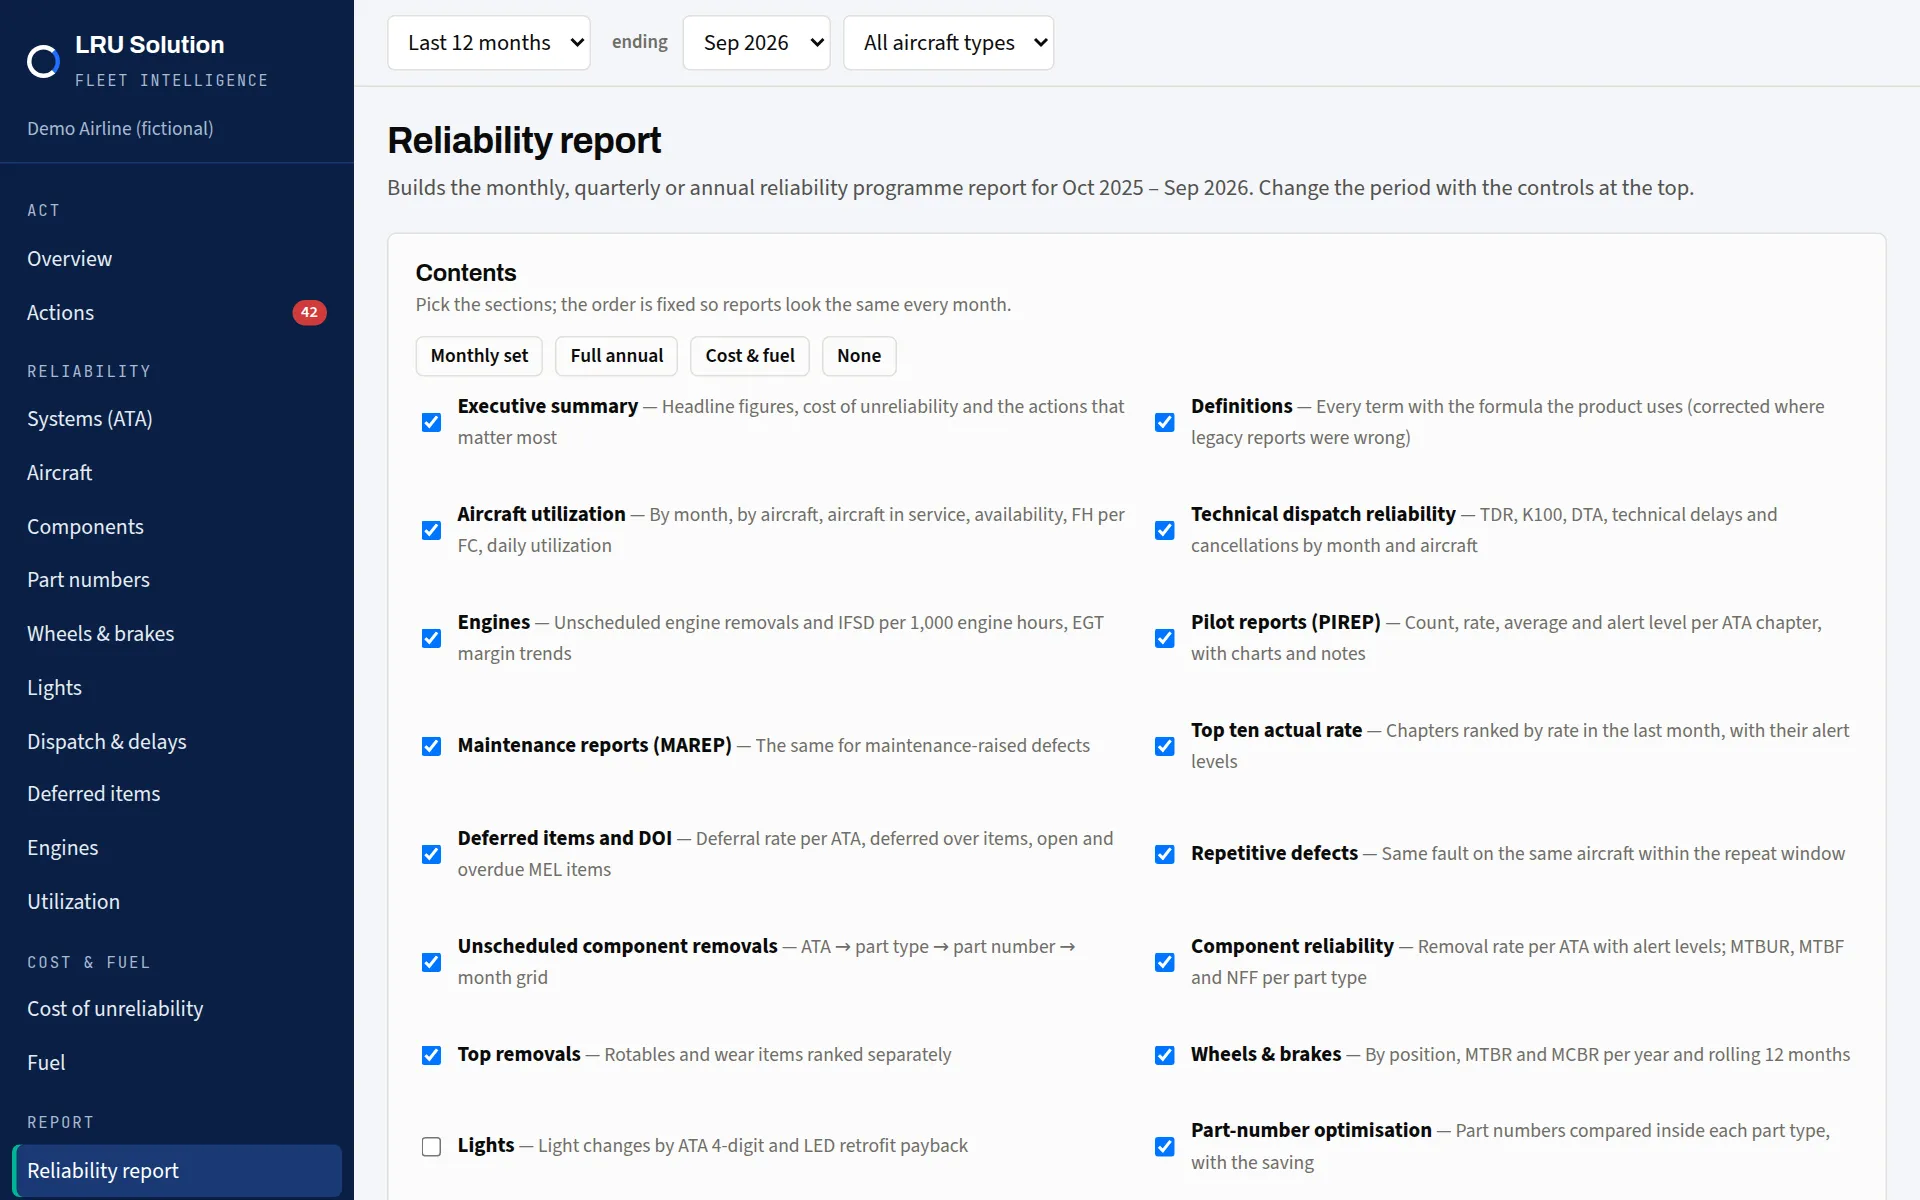
Eleven years of one real MD-80 operator
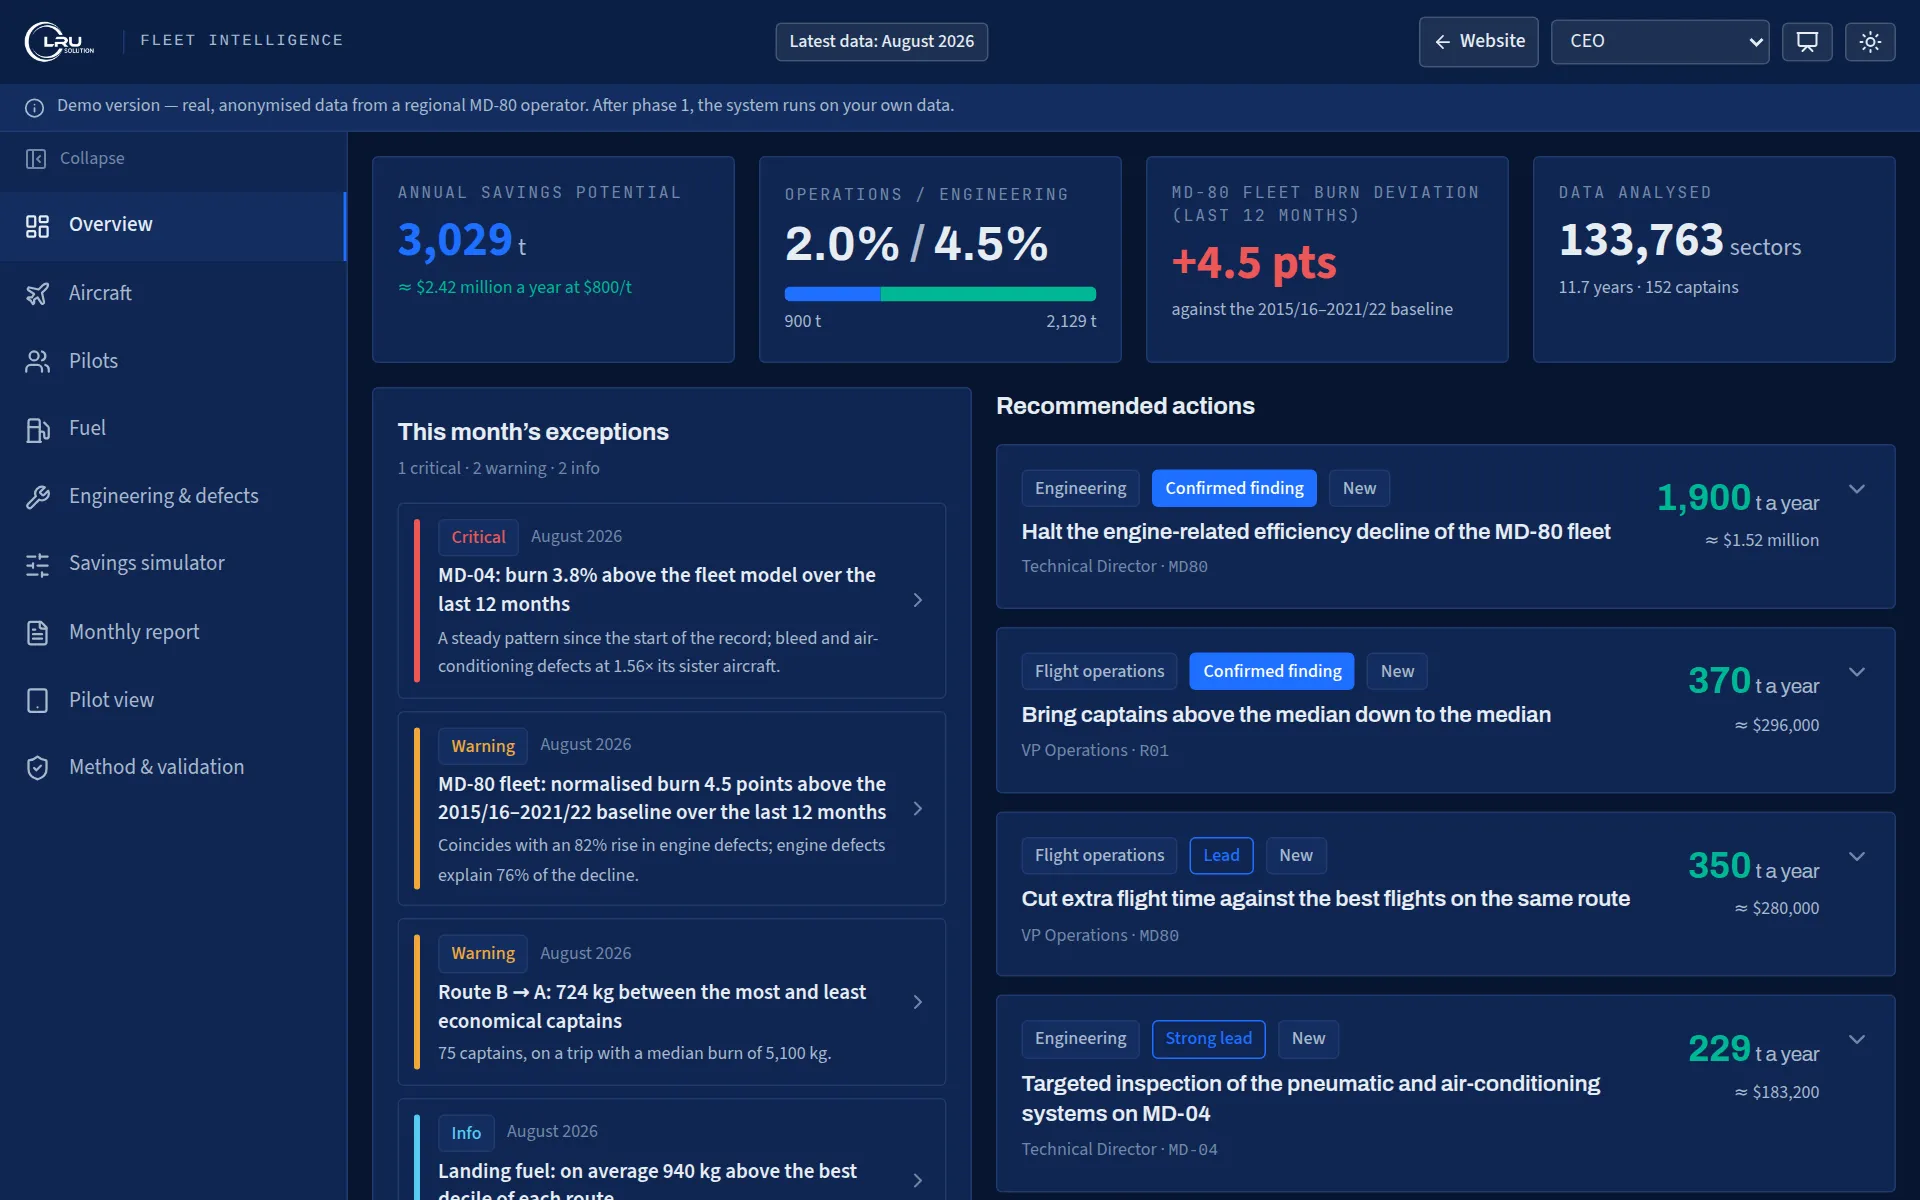
133,763 real flights and 58,068 technical-log defects from a regional operator, anonymised. The study went further than the platform's standard checks: crew technique on the same route and type, flight time against the best flights, and the season. It opens in your browser.
Three things the study found
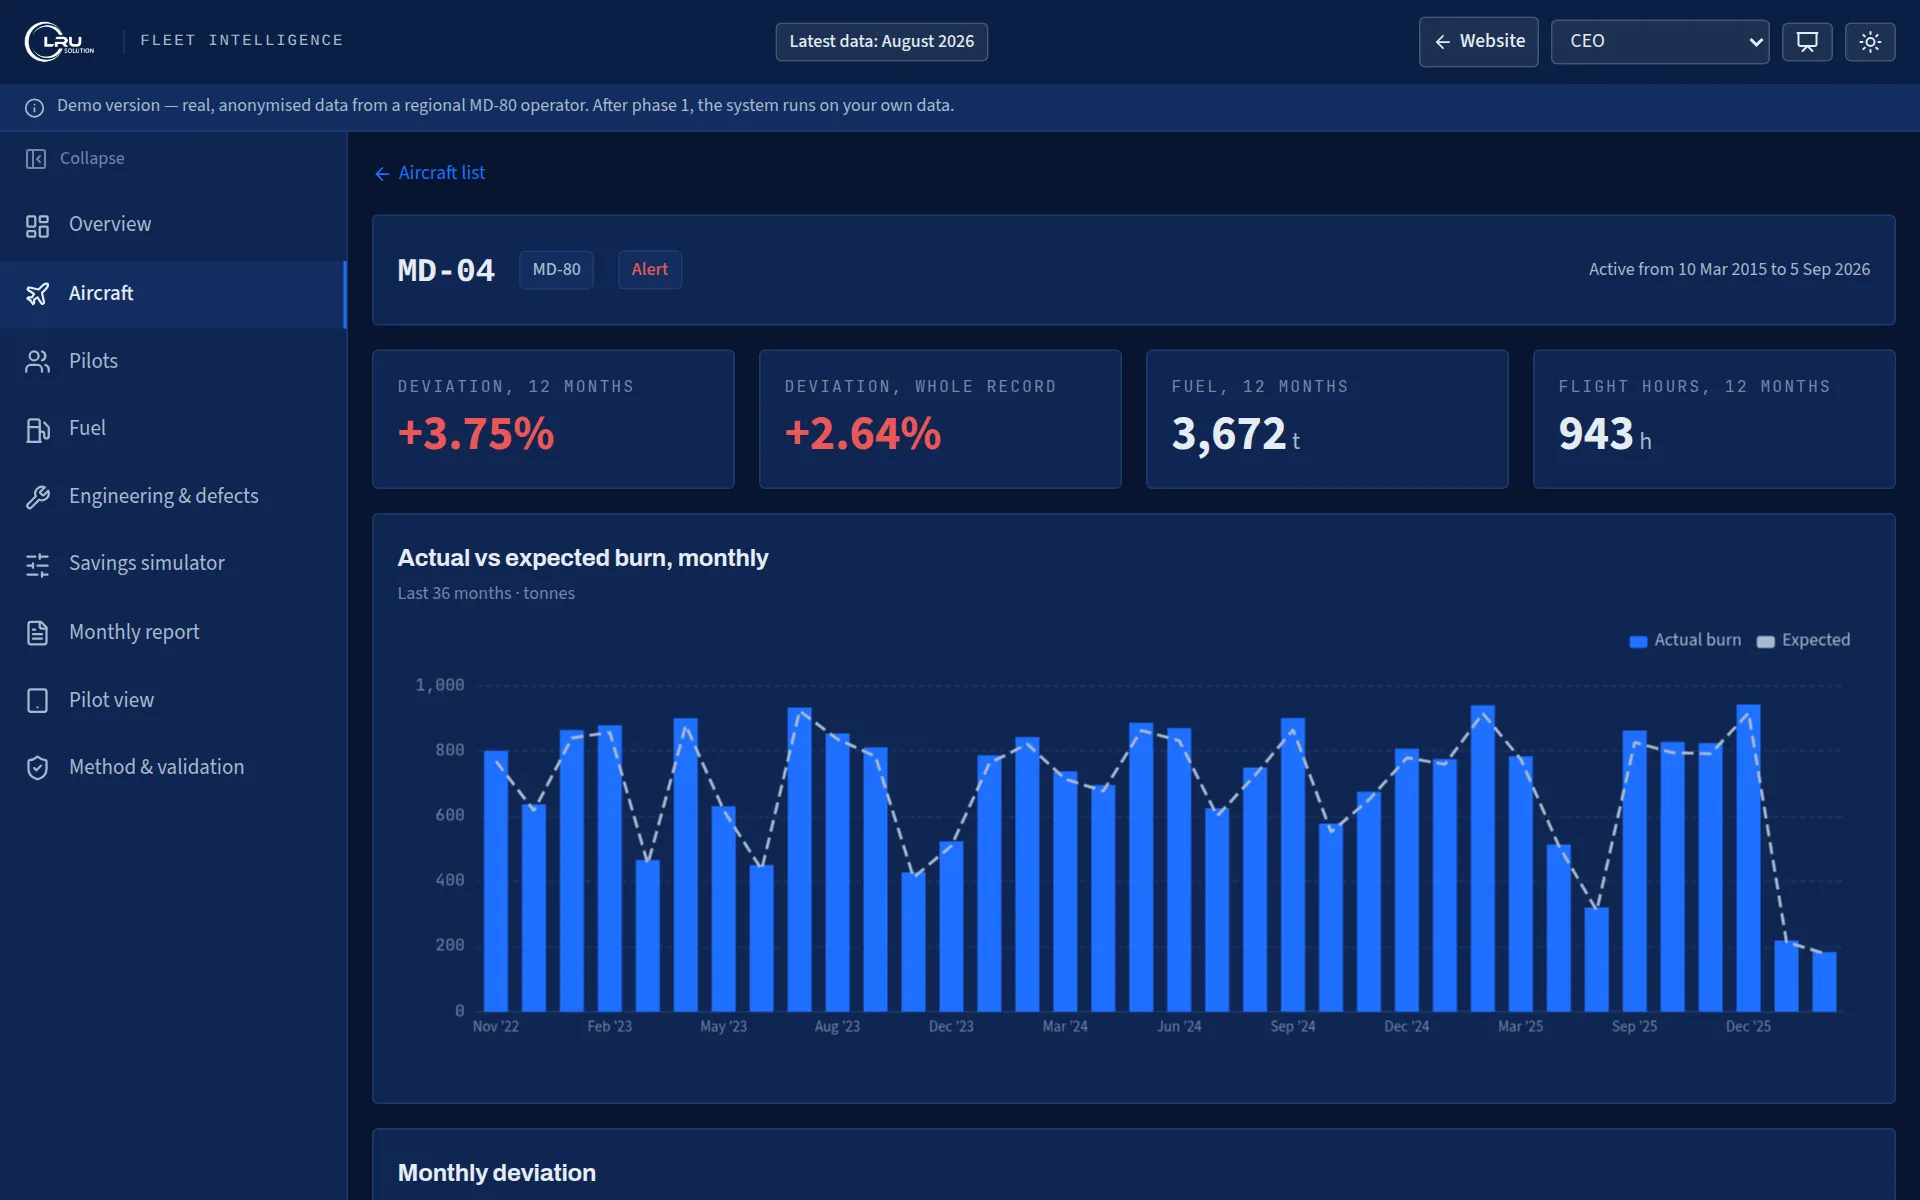
Above the model every year
One aircraft burned more than the fleet model expected in every year on record. Its engines were normal; its bleed and air-conditioning defects were not. Fifteen engine changes made no difference.
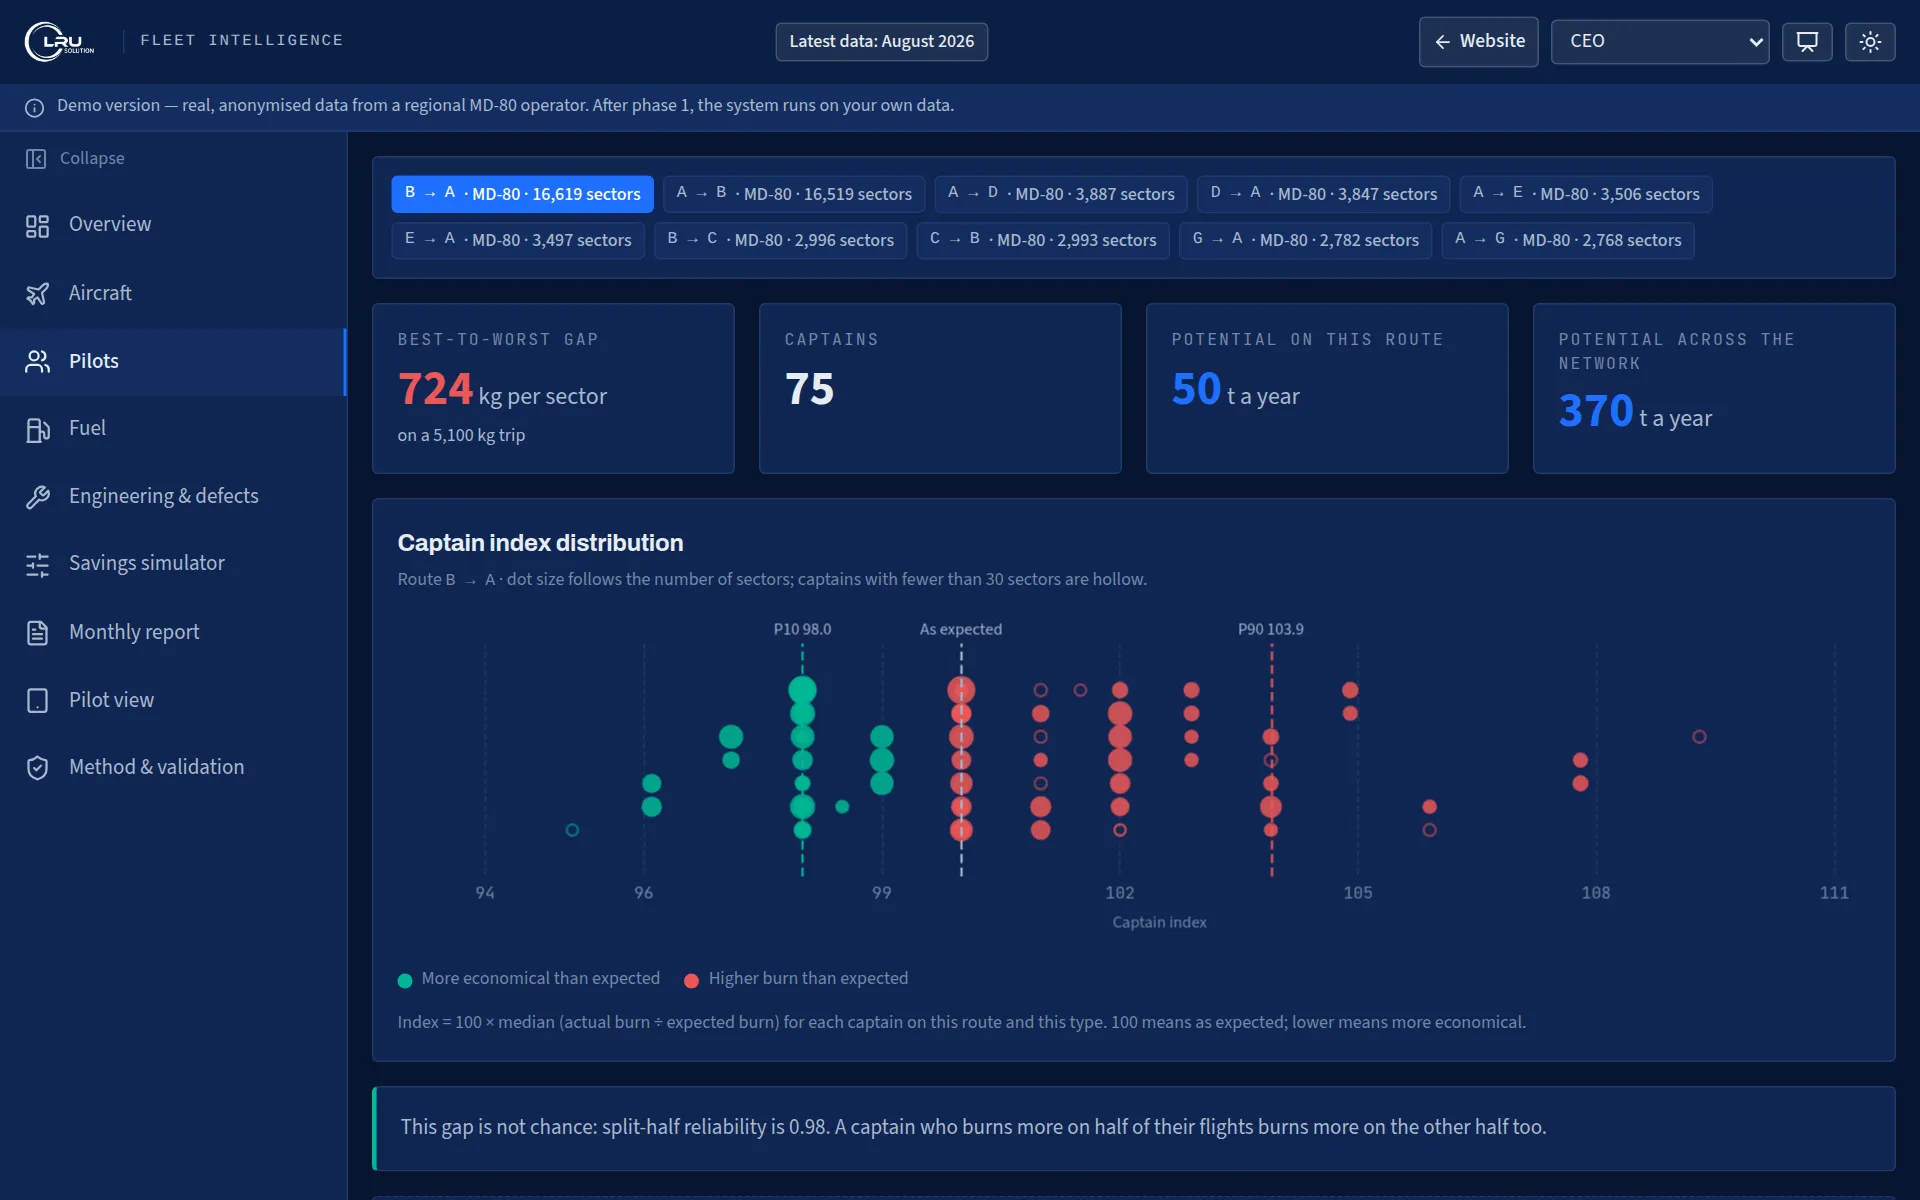
Same route, same aircraft
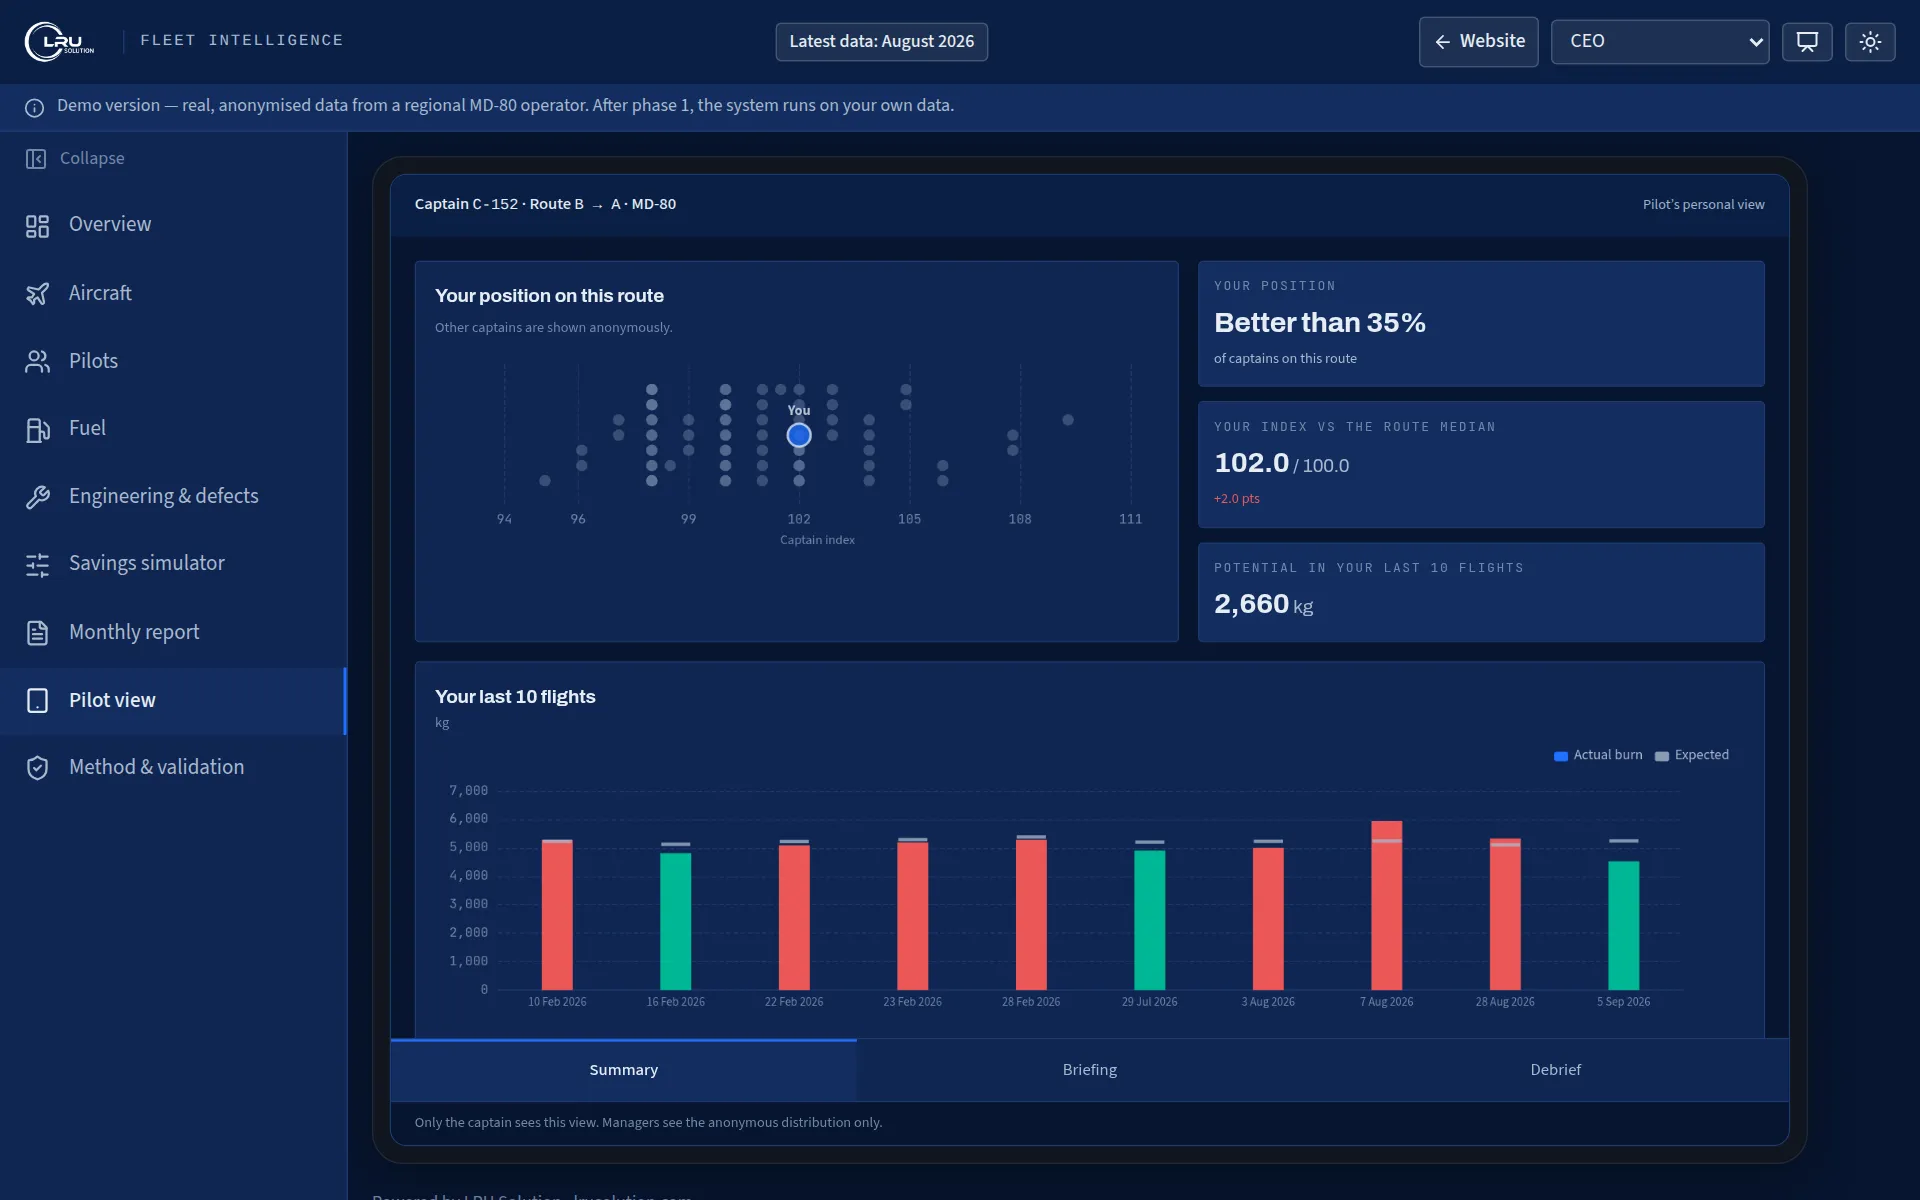
On the busiest route, 724 kg per sector separates the most and least economical captains, and the gap is stable. Managers see an anonymous distribution; each captain sees only their own record.
Fuel carried home
The fleet lands with a median 5,450 kg of fuel after a 4,900 kg trip. The demo shows what a controlled cut is worth, within the legal minimums.
How to use the fuel study
- Pick a role to start: CEO, operations, technical, fuel efficiency team or pilot. Each one opens on the view that role would use.
- Or press Start the guided presentation for a ten-step tour of the main findings.
- Every finding comes with a drafted work order you can copy.
- It works best on a laptop or a larger screen.
About the data
These are real flights and defects from one regional operator. Its name, aircraft registrations, pilot names, airport codes and flight numbers have been removed or replaced with codes; the numbers are unchanged. Dates are shown in the Gregorian calendar. Dollar values use an example fuel price of $800 a tonne, the same as our fuel calculator, and you can change it inside the study.
The study runs in your browser. Nothing you do inside it is sent to us.